Manager User Guide
Leaderboard
Access: From the main dashboard, select the 'Performance Leaderboard' tab. Summary: - Team Rankings: Gain insights into the performance of your team members. - Points: Analyze the points earned by each team member to assess their contribution.
My Team's Satndings
Access: From the main dashboard, select the 'Team’s Top Performer”' section.
Summary: - Rank: Understand your position within the team in the organization. Use this to motivate your team and aim for higher rankings.
-
Name: View individual team member names for a personalized analysis. Conduct one-on-one reviews or appreciate top performers.
-
Points: Analyze the contribution of each member. Understand who is contributing most and recognize their efforts.
-
Filter Button: Refine the displayed data based on specific criteria.
-
Time Period: Review performance for specific durations like weekly, monthly, or quarterly.
-
Leads: Understand the performance based on specific leads.
-
Goals: Ensure that the team is aligned with the organizational goals set by higher authorities.
-
Activity: Analyze performance based on specific activities or tasks.
My Standings
Access: From the main dashboard,swipe right and select the my standings section.
-
My Standings: A section that shows the user's current ranking and points earned.
-
Rank: The user's current rank on the leaderboard.
-
Points: The total number of points earned by the individual.
-
Filter Button: A section that contains the different filter options to search for options within my team’s standings.
-
Time Period: This filter allows users to filter the leaderboard by specific From and To dates.
-
Leads: This filter allows the user to filter the leaderboard by specific leads.
-
Goals: This filter allows the user to filter the leaderboard by a specific goal set by the higher authorities. This can be useful for tracking the performance of a specific team and their goals.
-
Activity: This filter allows the user to filter the leaderboard by a specific activity. This can be useful for tracking performance on a specific activity or comparing performance on different activities.
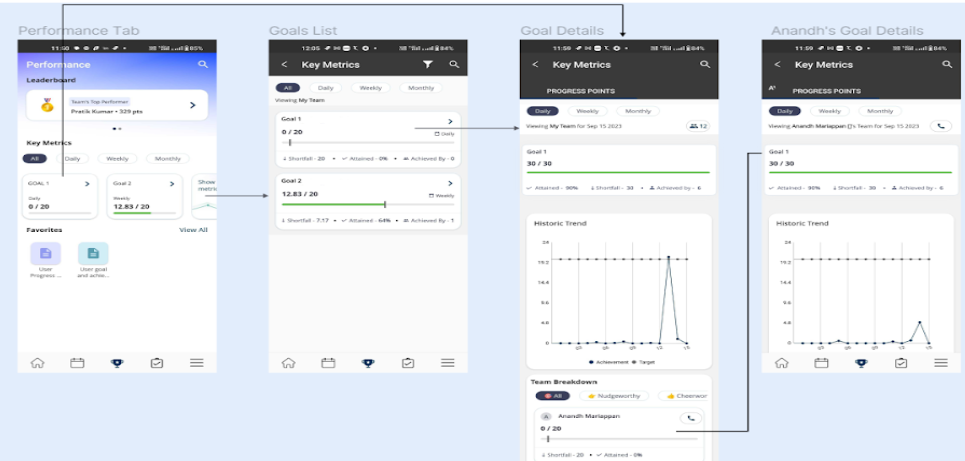
Key Metrics Overview:
The "Key Metrics" section offers a comprehensive view of a user's performance, providing a breakdown of progress points achieved on a daily, weekly, and monthly basis. This section aids in understanding the trajectory of one's performance, helps in identifying strengths and areas of improvement, and keeps users motivated toward their set goals.
Leaderboard Filters:
-
All: View the all-time performance leaderboard.
-
Daily: Concentrate on today's performance standings.
-
Weekly: Check out the leaderboard for the ongoing week.
-
Monthly: Analyze the performance rankings for the current month.
Use the filters to customize the key metrics views based on your interests.
Detailed Metrics :
-
Shortfall: Shows the gap between the user's set goal and achieved points. This can act as a motivator to bridge the difference.
-
Attained: This metric shows the percentage of the target that the user has achieved. For example, if the target is 500 and the user has achieved 250, then 50% of the target has been attained.
-
Achieved By: This section shows As a manager it shows how many reporters under him achieved the target for that particular goal.
Historic Trend:
Gain insights from your performance progression over time. This feature is crucial for understanding long-term trends and making goal adjustments as required.
Performance Progression:
Swiping right on the historic trend will reveal a graphical representation of performance progression. It's a visual tool to understand performance trajectories.
Team Breakdown:
Nudgeworthy: The nudgeworthy section is designed to help users identify areas where they may need to improve their performance in order to achieve their goals. This can be done by comparing the user's performance to a threshold that has been set for a particular metric.
Cheerworthy: Celebrates successes and achievements. It's designed to appreciate and recognize good performance.
Navigation Guide for Key Metrics Section
- Open the main dashboard and navigate to the Key Metrics tab.
- View Average Progress Points for Daily, Weekly, or overall view using "Show All Key Metrics".
- Adjust the Leaderboard view using the filters: All, Daily, Weekly, or Monthly based on your preference.
- Dive deeper into your metrics using the Detailed Metrics with Filters. Check out your Shortfall, Attained points, Achieved By percentage, and use the "View Breakdown" for a granular report.
- Scroll down to access the Historic Trend section to gauge your performance over time.
- Swipe right on the historic trend to access the Performance Progression graph.
- Scroll further to find the Team Breakdown section. Recognize areas of improvement with "Nudgeworthy" and celebrate achievements with "Cheerworthy".
Favorites:
The Favorites section of Vymo SPM, is your personalized hub for swift and efficient access to crucial data points. Tailor your dashboard by pinning relevant widgets, metrics, or reports, ensuring that your most-used tools are always just a click away. As the sales landscape evolves, so can your Favorites, allowing for a dynamic and adaptable experience. Whether you're streamlining your own workflow or collaborating with team members, the Favorites feature is designed to elevate your Vymo SPM experience. Embrace organization, accessibility, and control, all in one place.