Activities reports
The standard reports and dashboards available out of the box for activities are listed on this page. All of these reports, unless otherwise stated, can be downloaded as .csv files. Also, all of the reports can be filtered by date range and person. Additional filters, if available, are mentioned in the description for the report.
The metrics used for calculating the numbers in these reports is at Activities metrics.
- Activities Cover
- Activity List
- Activity Planning Report
- Completed Task/Rep/Day
- Completed Tasks Over Time
- Outcome
- Overall Planned Task Breakdown
- Partner engagement report
- Planned Tasks Over Time
- Productivity
- Rescheduled/Activity
- Task Planning
- User Call Report
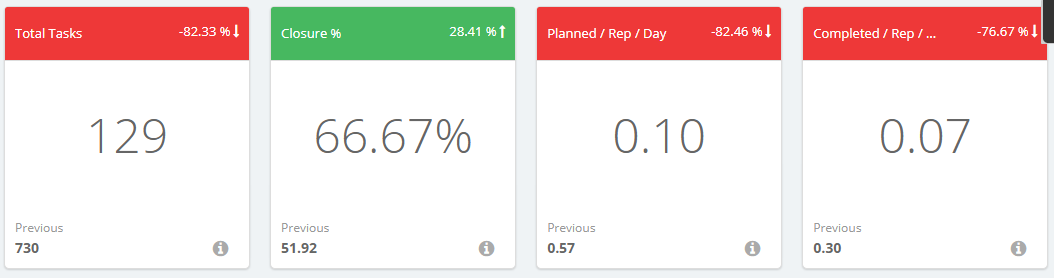
Activities Cover
This report shows the total number of tasks, their closure rate, and the average number of tasks planned and completed by people in a day. To see it, click Activities > Cover.
The report contains the following columns:
- Total tasks: Total number of planned tasks that day
- Closure percentage: Percentage of tasks closed that day
- Planned/Rep/Day: Average number of tasks planned by people that day
- Completed/Rep/Day: Average number of tasks completed by people that day
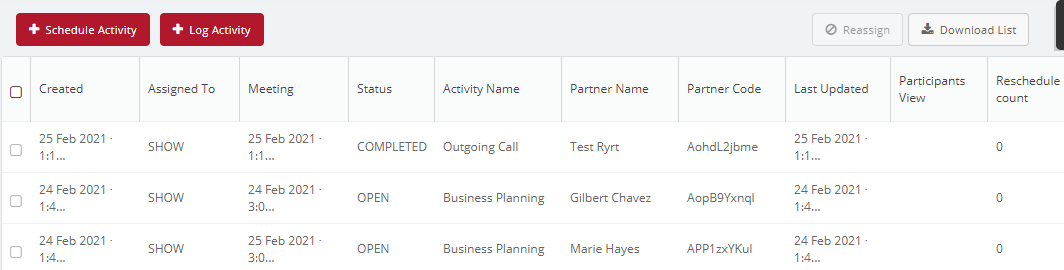
Activity List
This report shows the status of all activities. To see it, click Activities > Activity List.
The report contains the following columns:
- Created: The date when the activity was created
- Assigned to: The name of the person
- Meeting: The date and time of the activity
- Status: Whether the activity is completed
- Activity name: The name of the activity
- Partner name: The lead or partner to meet or call
- Partner code: The code assigned to the lead or partner
- Last updated: The date and time when the last update was made to this activity
- Reschedule count: The number of times the activity was rescheduled
Activity Planning Report
This report shows the number of tasks planned and completed by each user. To see it, click Reports > All Reports > Activities Analytics > Activities Planning Report.
The report contains the following columns:
- User name: The name of the person
- Planned task: The number of tasks that the person planned to complete
- Completed activity: The number of tasks that the person was able to complete
Completed Task/Rep/Day
This card shows the ratio of daily completed activities to the number of agents. To see it, click Reports > All Reports > Activities Analytics > Activity Efficiency Report.
Completed Tasks Over Time
This graph shows the number of tasks completed on a given date. To see it, click Reports > All Reports > Activities Analytics > Activities Planning Report.
Outcome
This report shows activities and the number of completed activities on a specific date. To see it, click Reports > All Reports > Activities Analytics > Activity Distribution.
Overall Planned Task Breakdown
This pie chart and bar graph shows the total number of activities planned by type in the given time range. To see it, click Reports > All Reports > Activities Analytics > Activity Distribution Report.
Partner engagement report
To see it, click All reports > Activities Analytics > Partner engagement report.The report contains the following columns:
- Partners name: Name of the active partners of the selected module
- Assignee: The person or user to who the partner is assigned
- Last engaged on: Date and time of the last activity with the partner
- Activities in selected date range: Number of times the partner was engaged in the selected date range
- No. of X activities: No. of activities of X activity type performed in the selected date range. X could be any activity as per your company.
- No. of Physical visits: This column is shown if geo-verified visit or automatic detection feature is enabled
- Avg. time per visit: Average time for each visit. This column is shown if the automatic visit detection feature is enabled
Planned Tasks Over Time
This graph shows the number of tasks planned for a given date. To see it, click Reports > All Reports > Activities Analytics > Activities Planning Report.
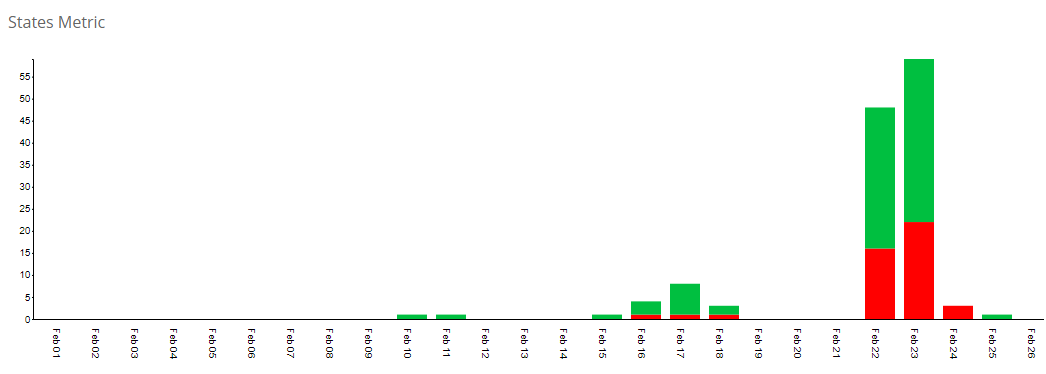
Productivity
This chart shows the numbers for the activity states. To see it, click Activities > Productivity.
The X-axis is for the date and the Y-axis for the count of activities created, completed, cancelled, and rescheduled.
Rescheduled/Activity
This card shows the ratio of the total number of times a reschedule happened to the total number of created activities. To see it, click Reports > All Reports > Activities Analytics > Activity Efficiency Report.
Task Planning
This report shows the number of planned and completed activities (including logged activities), and their percentages. The table shows the planned task and completed activities of all team members. To see it, click Reports > All Reports > Activities Analytics > Other Activity Reports.
The report contains the following columns:
- User Name: Name the person
- Planned Task: Number of activities completed
- Completed activity: Number of activities completed
User Call Report
If you're using a web telephone service (such as Exotel) to make in-app calls, this report shows daily trends. You can see the average number of calls made, average call duration, call completion rate (calls connected divided by the total calls made), and the status (whether completed, busy, not answered, or failed).
Call recordings are also available. If you don't see them, contact Vymo Support.
To see it, click Reports > Call Reports > User Call Reports.
This report has additional filters of hour.
The report contains the following columns:
- User Code: The employee code
- User Name: The name of the person
- Lead or Partner Name: The name of the lead or partner who was called
- Call Start Time: The time when the call was placed through the app
- Call End Time: The time when the call was ended
- Duration: The duration of the call, which includes the time taken by the device to connect to a web telephone service, and the time elapsed before the other person answered the call
- Call status: Whether the call went through, was answered, or was cancelled
- Recording URL: A click-and-listen link to the call recording