Leads reports
These are the standard reports and dashboards that are available for each lead module that's configured for your company.
All of these reports, unless otherwise stated, can be downloaded as .csv files. Also, all of the reports can be filtered by user name, date range, and the names of the leads modules configured for your company. Additional filters, if available, are mentioned in the report description.
The metrics used for calculating the numbers in these reports is at Leads metrics.
- Conversion Count by User
- Lead Aging Report
- Lead Conversion - By Lead Closure Turnaround Time
- Lead Conversion - By Priority
- Lead Conversion - By State
- Lead Conversion Cards
- Lead Conversion Report
- Lead Engagement - Meetings Per User Per Day
- Lead Engagement - State Distribution (Cold Leads)
- Lead Engagement - State Distribution (Hot Leads)
- Lead Engagement - State Distribution (Warm Leads)
- Lead Engagement - Time To First Meeting
- Lead Engagement By Priority
- Lead Engagement By User
- Lead Meeting Efficiency - Meetings Done
- Lead Meeting Efficiency - Total Meetings
- Lead Stage Analysis
- Lead Stage Analysis - Lead Funnel Across Users
- Lead Stage Analysis - Number of leads in each state
- Leads List
- Leads Productivity
- Pipeline Dashboard - Count of Leads Won
- Pipeline Dashboard - Count of New Leads Over Time
- Pipeline Dashboard - Leads Lost Over Time
- Pipeline Dashboard - Time to First Meeting
- Pipeline Dashboard - Total Meeting Duration
- Planned And Completed Lead Meetings - Completed Lead Meetings
- Planned And Completed Lead Meetings - Fresh Lead Meetings By Date
- Planned And Completed Lead Meetings - Leads Created By Date
- Planned And Completed Lead Meetings - Meetings Scheduled
- Planned And Completed Lead Meetings - Repeat Lead Meetings By Date
- Win-Loss Analysis
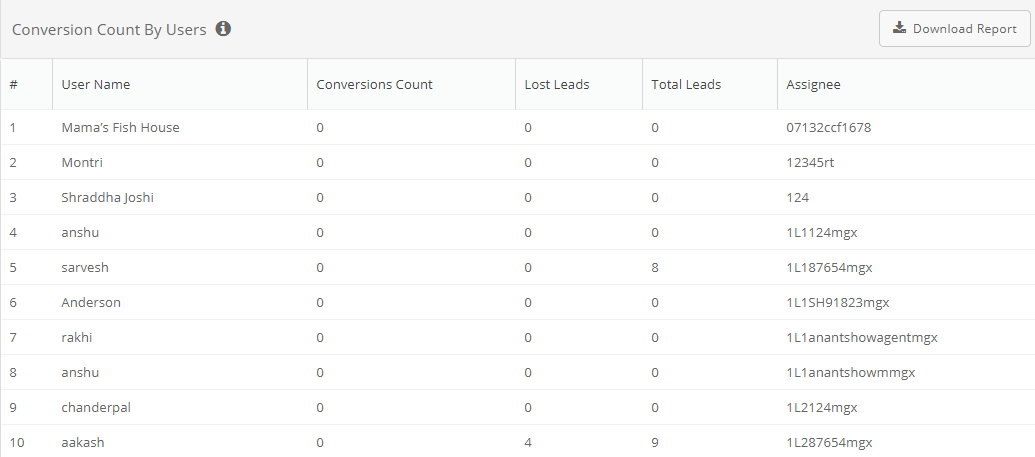
Conversion Count by User
This reports shows the number of leads sourced, won, and lost by someone in a given time period. To see it, click Reports > All Reports > Conversion Count by User.
The report contains the following columns:
- User Name: The person's name
- Conversions Count: The number of leads the person converted to a win
- Lost Leads: The number of leads the person could not convert to a win
- Total Leads: The number of leads generated by the person
- Assignee: The ID of the person
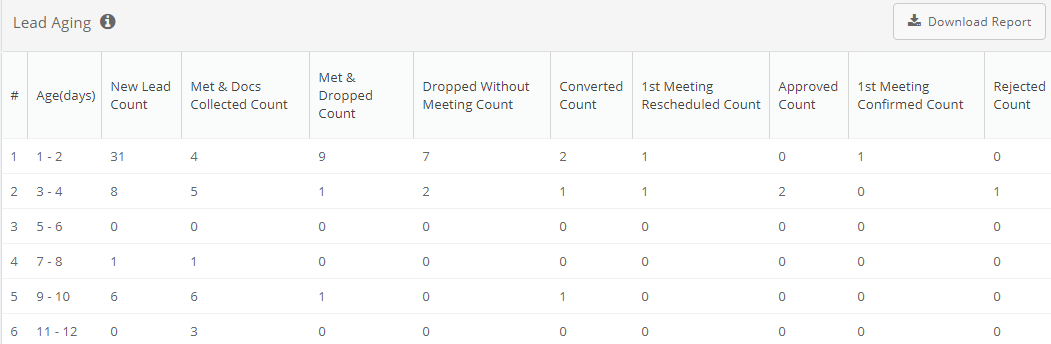
Lead Aging Report
This reports shows lead counts, grouped by the number of days since the last update and the stage it was updated to. To see it, click Reports > All Reports > Lead Analytics > Lead Aging Report.
The report contains the following columns:
- Age (days): The number of days since the lead moved to one of these states
- New Lead: The total number of leads generated that day
- Met and Docs Collected: The total number of leads met with that day
- Met and Dropped: The total number of leads met with that day and closed
- Dropped Without Meeting: The total number of leads closed that day without meeting
- Converted: The total number of leads converted that day
- 1st Meeting Rescheduled: The total number of leads with whom meetings were rescheduled that day
- Approved: None
- 1st Meeting Confirmed: The total number of leads with whom meetings were confirmed that day
- Rejected: None
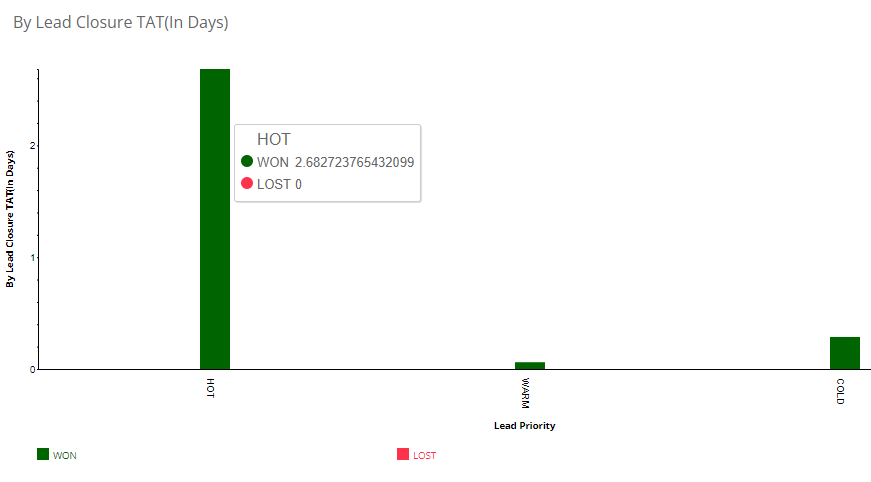
Lead Conversion - By Lead Closure Turnaround Time
This graph shows the numbers of days that it took for leads to reach a closed state, whether won or lost, grouped by priority (for the counts, move the cursor over a bar of the chart). To see it, click Reports > All Reports > Lead Analytics > Lead Conversion Report.
The X-axis is for the lead priority and the Y-axis for the number of days.
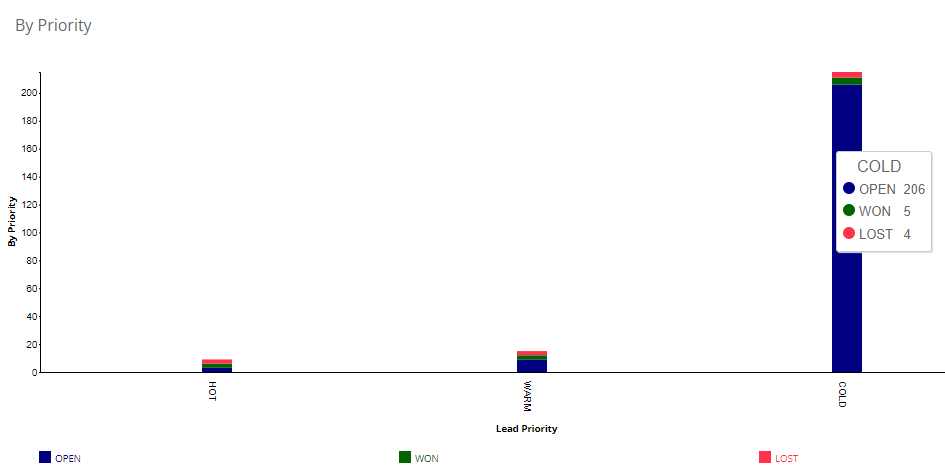
Lead Conversion - By Priority
This graph shows the numbers for open, won, and lost leads, grouped by priority (for the counts, move the cursor over a bar of the chart). To see it, click Reports > All Reports > Lead Analytics > Lead Conversion Report.
The X-axis is for the lead priority and the Y-axis for the number of days.
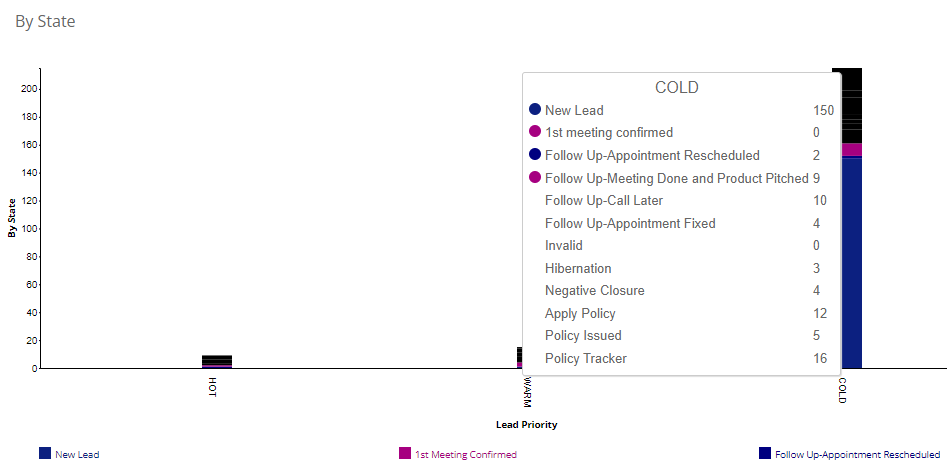
Lead Conversion - By State
This graph shows the numbers for the states that the leads are in, grouped by priority (for the counts, move the cursor over a bar of the chart). To see it, click Reports > All Reports > Lead Analytics > Lead Conversion Report.
The X-axis is for the lead priority and the Y-axis for the number of days.
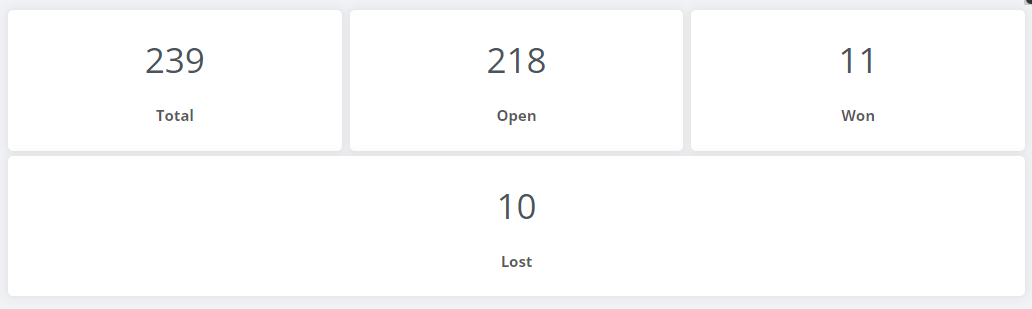
Lead Conversion Cards
These cards are a snapshot of the number of open, won, and lost leads To see it, click Reports > All Reports > Lead Analytics > Lead Conversion Report.
The cards show the counts for total leads, leads won, leads lost, and leads open.
Lead Conversion Report
This reports shows the numbers for open, won, and lost leads, separately for hot, warm, and cold leads, for every person on your team. To see it, click Reports > All Reports > Lead Analytics > Lead Conversion Report.
The report contains the following columns:
- User Name: The name of the person
- User Code: The employee code of the person
- User Role: The role assigned to the person
- Total Hot: Of all the leads assigned to this person, the number of hot leads, whether open or closed
- Total Warm: Of all the leads assigned to this person, the number of warm leads, whether open or closed
- Total Cold: Of all the leads assigned to this person, the number of cold leads, whether open or closed
- Open Hot: Of all the leads assigned to this person, the number of hot leads that are still open
- Open Warm: Of all the leads assigned to this person, the number of warm leads that are still open
- Open Cold: Of all the leads assigned to this person, the number of cold leads that are still open
- Won Hot: Of all the leads won by this person, the number of leads that were hot
- Won Warm: Of all the leads won by this person, the number of leads that were warm
- Won Cold: Of all the leads won by this person, the number of leads that were cold
- Lost Hot: Of all the leads lost by this person, the number of leads that were hot
- Lost Warm: Of all the leads lost by this person, the number of leads that were warm
- Lost Cold: Of all the leads lost by this person, the number of leads that were cold
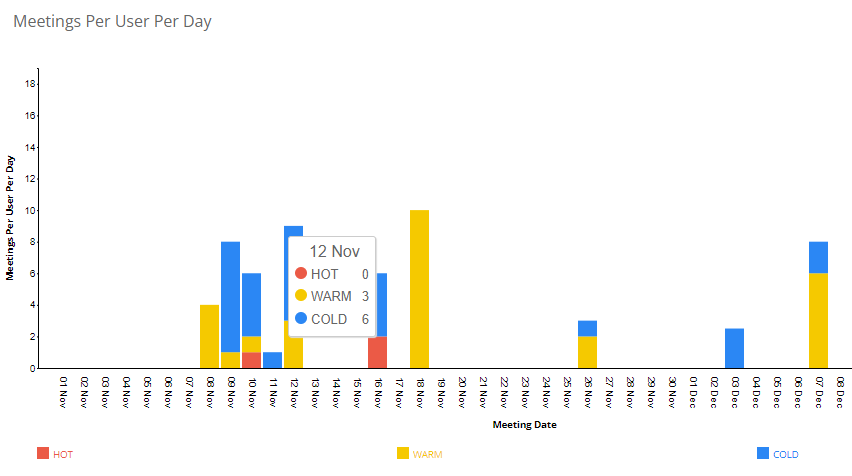
Lead Engagement - Meetings Per User Per Day
This graph shows the average number of meetings that happened on a day, grouped, stacked by lead priority (for the numbers for a day, move the cursor over the stack for that day). To see it, click Reports > All Reports > Lead Analytics > Lead Engagement Report.
The X-axis is for the date and the Y-axis for the number of days.
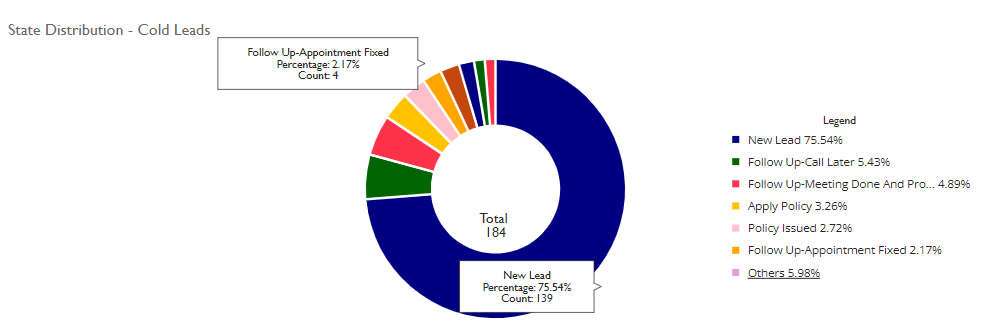
Lead Engagement - State Distribution (Cold Leads)
This chart shows the states that all the cold leads are in (for the counts, move the cursor over a segment of the chart). To see it, click Reports > All Reports > Lead Analytics > Lead Engagement Report.
The segments of the chart show the counts and percentages of the states.
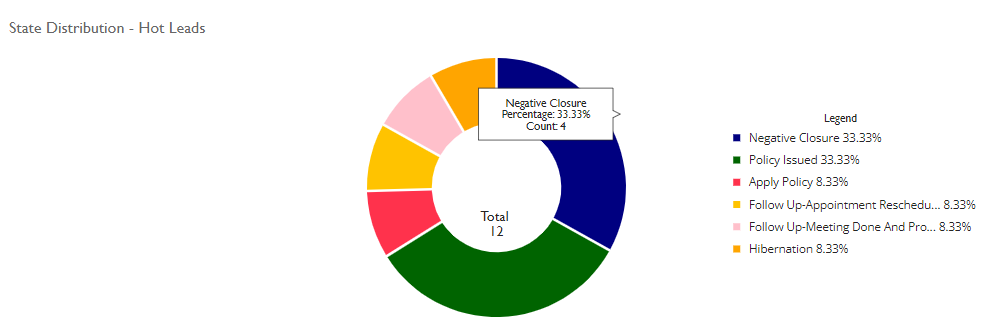
Lead Engagement - State Distribution (Hot Leads)
This chart shows the states that all the hot leads are in (for the counts, move the cursor over a segment of the chart). To see it, click Reports > All Reports > Lead Analytics > Lead Engagement Report.
The segments of the chart show the counts and percentages of the states.
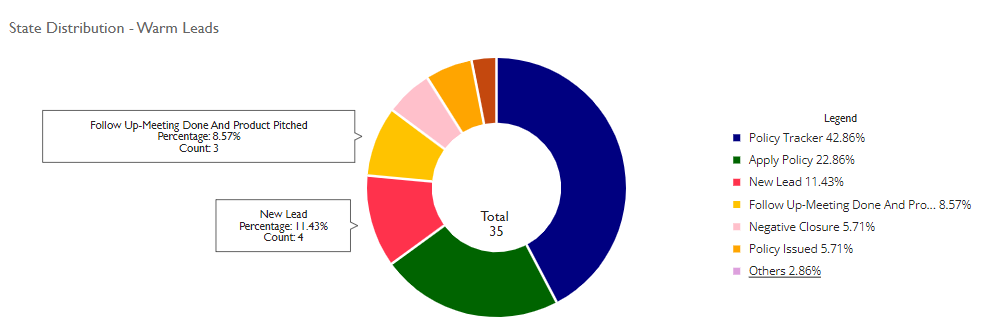
Lead Engagement - State Distribution (Warm Leads)
This chart shows the states that all the warm leads are in (for the counts, move the cursor over a segment of the chart). To see it, click Reports > All Reports > Lead Analytics > Lead Engagement Report.
The segments of the chart show the counts and percentages of the states.
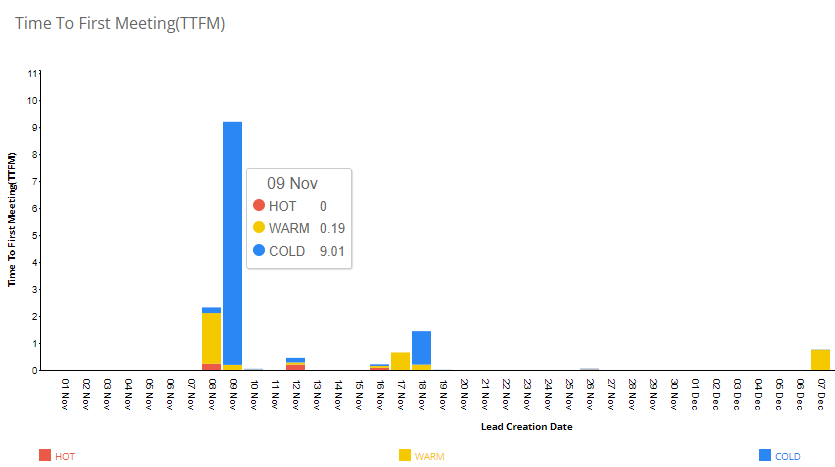
Lead Engagement - Time To First Meeting
This graph shows the number of open leads, stacked by priority, on any day against the number of days it took to meet them for the first time (for the numbers for a day, move the cursor over the stack for that day). To see it, click Reports > All Reports > Lead Analytics > Lead Engagement Report.
The X-axis is for the date and the Y-axis for the number of days.
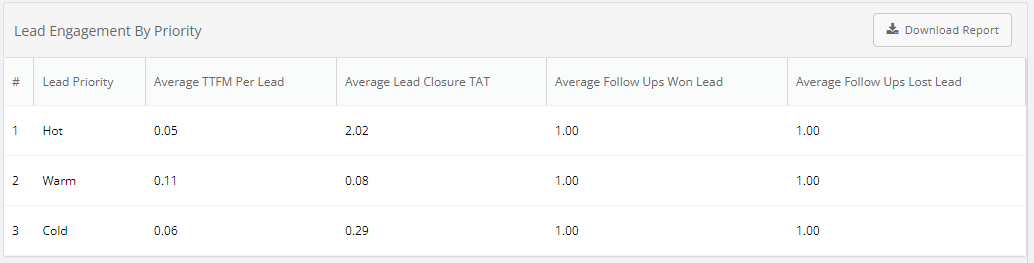
Lead Engagement By Priority
This reports shows the number of days to first meeting, days to closure, and the number of follow-ups for won and lost leads, with the leads grouped by priority. To see it, click Reports > All Reports > Lead Analytics > Lead Engagement Report.
The report contains the following columns:
- Lead Priority: The priority of the leads
- Average TTFM Per Lead: The average number of days for time to first meeting
- Average Lead Closure TAT: The average number of days for a lead to move from a new state to either won or lost
- Average Follow Ups Won Lead: The average number of follow-ups that a lead needed to move to a won state
- Average Follow Ups Lost Lead: The average number of follow-ups that a lead needed to move to a lost state
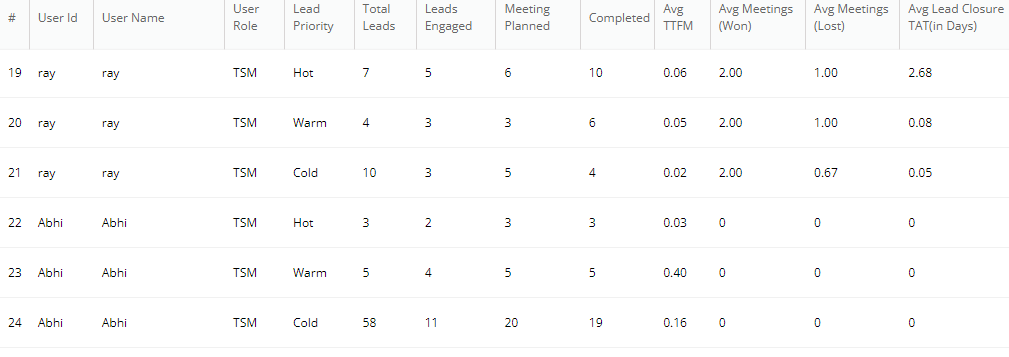
Lead Engagement By User
This reports shows how a person engaged with the leads assigned to them before moving the leads to a closed state. To see it, click Reports > All Reports > Lead Analytics > Lead Engagement Report.
The report contains the following columns:
- User Id: The employee ID of the person
- User Name: The name of the person
- User Role: The role assigned to that person
- Lead Priority: The priority of the lead, which can be hot, warm, or cold
- Total Leads: The number leads assigned to that person
- Leads Engaged: The number of leads that the person called
- Meeting Planned: The number of leads with whom a meeting is scheduled
- Completed: The number of leads that the person met already
- Avg TTFM: The average time the person took to meet a lead for the first time
- Avg Meetings (Won): The average number of meetings that this person needed to win a lead
- Avg Meetings (Lost): The average number of times this person met a lead before losing that lead
- Avg Lead Closure TAT(in Days): The average number of days that it took this person to either win or lose a lead
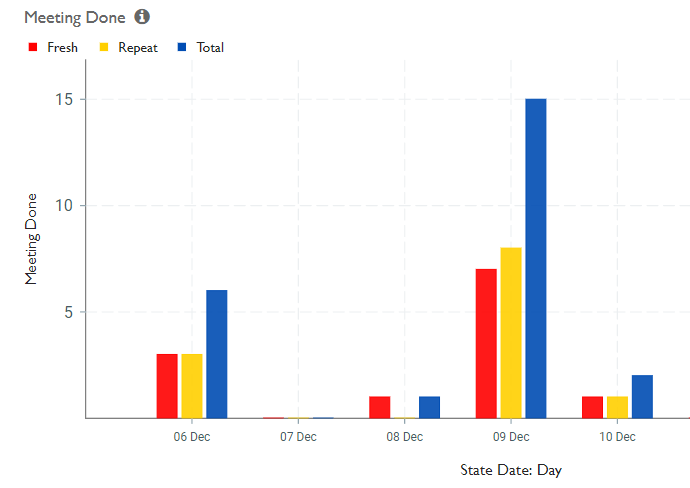
Lead Meeting Efficiency - Meetings Done
This graph shows the number of leads met for the first time, met again thereafter, along with the total number for a day. To see it, click Reports > All Reports > Lead Analytics > Lead Meeting Efficiency.
The X-axis is for the date and the Y-axis for the numbers.
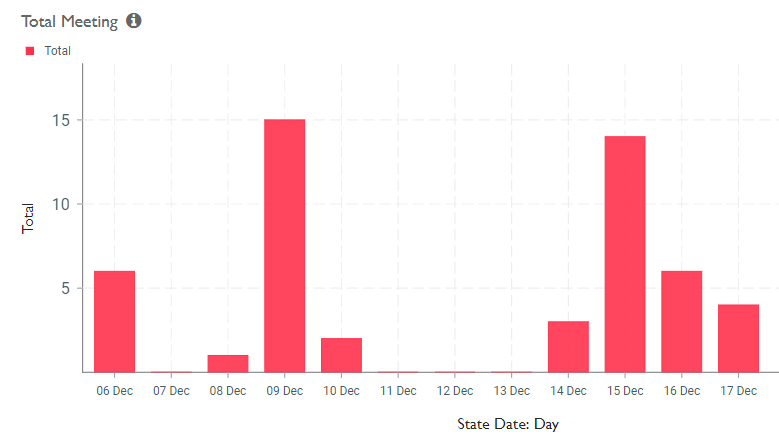
Lead Meeting Efficiency - Total Meetings
This graph shows the total number of leads met on a day. To see it, click Reports > All Reports > Lead Analytics > Lead Meeting Efficiency.
The X-axis is for the date and the Y-axis for the numbers.
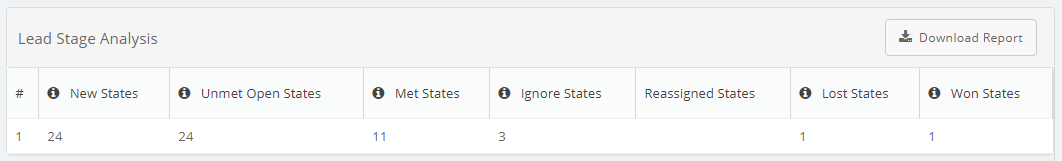
Lead Stage Analysis
This report shows the number of times that a lead entered each state of the sales cycle. To see it, click Reports > All Reports > Lead Analytics > Lead Stage Analysis.
The report contains the following columns:
- New states: The number of times a lead was in the New state
- Unmet open states: The number of times a lead was in the Unmet state
- Met states: The number of times a lead was in any of these states: First meeting confirmed, lead met with, documents collected
- Ignore states: The number of times a lead was in any of these states: Attempted to call, assigned, reassigned, reactivated, rescheduled, incoming call
- Reassigned states: The number of times a lead was in any of the reassigned states
- Lost states: The number of times the state of a lead was either Dropped without meeting or Met and dropped
- Won states: The number of times a lead was in the Converted state
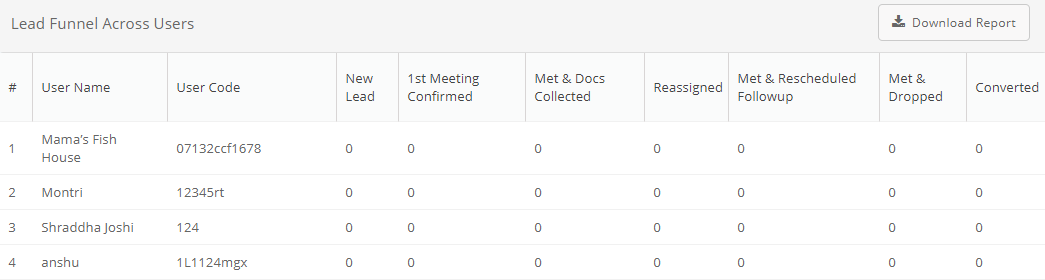
Lead Stage Analysis - Lead Funnel Across Users
This report shows the number of leads in each stage for each user. To see it, click Reports > All Reports > Lead Analytics > Lead Stage Analysis.
The report contains the following columns:
- User name: The name of the person
- User code: The ID of the person
- New lead: The number of leads generated by the person
- Fist meeting confirmed: The number of leads the person had confirmed meetings with
- Met and collected docs: The number of leads the person met
- Reassigned: The number of leads that the person reassigned to someone else
- Met and rescheduled follow-up: The number of leads this person met and booked a follow-up meeting with
- Met and dropped: The number of leads that this person met and could not convert to a win
- Converted: The number of leads that the person converted to a win
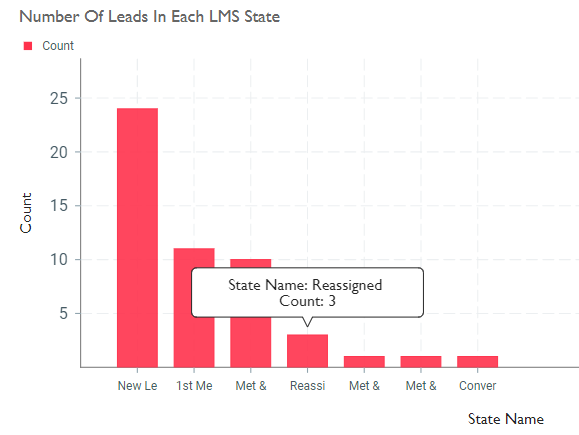
Lead Stage Analysis - Number of leads in each state
This graph shows the number of leads in each state. To see it, click Reports > All Reports > Lead Analytics > Lead Stage Analysis.
The X-axis is for the state and the Y-axis for the count.
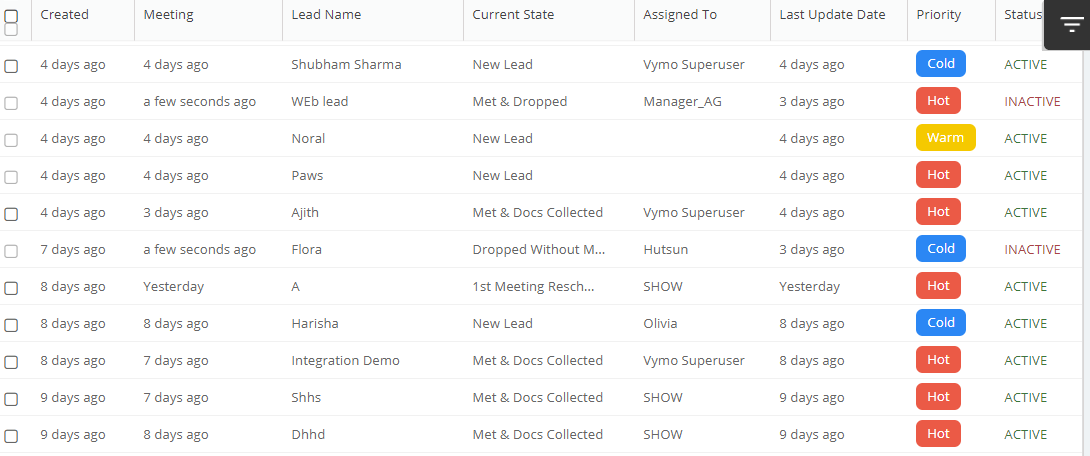
Leads List
This report shows all open leads, their priority and current state, and the person they're assigned to. To see it, click Leads > Leads list. This report has additional filters of campaign, meeting date range, priority, and tier.
The report contains the following columns:
- Created: The time when the lead was created, reported as the difference between today and the creation date
- Meeting: The time when someone met the lead, reported as the difference between today and the creation date
- Lead Name: Name of the lead
- Current State: State of the lead
- Assigned To: The person the lead is assigned to
- Last Update Date: The date when the lead details were last update
- Priority: The priority of the lead
- Status: The status of the lead
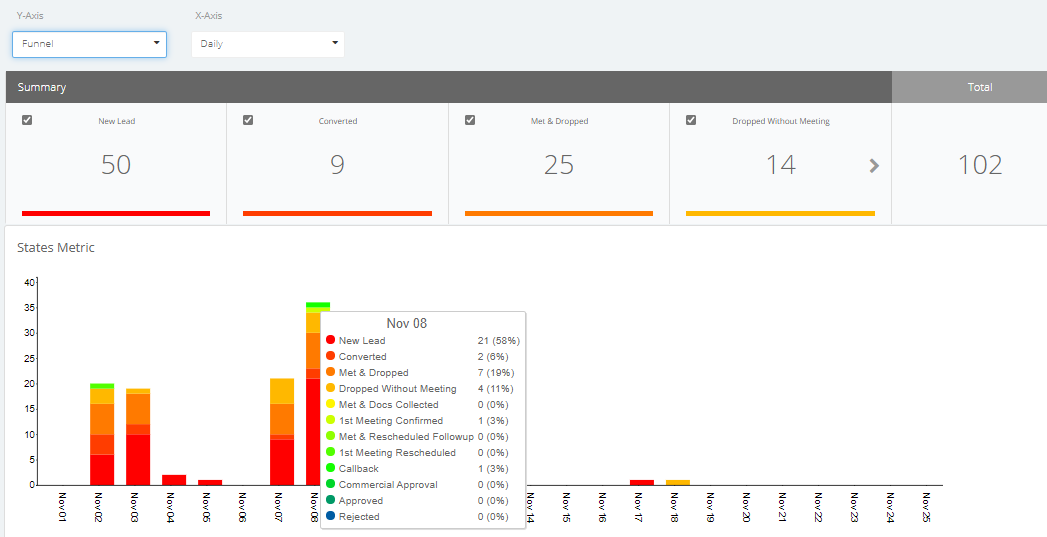
Leads Productivity
This graph shows the the total amount of time spent on a meeting with the lead. To see it, click Leads > Productivity.
The X-axis is for Funnel, total leads received, meetings, meetings in a day, number of products sold, net business indicator, average ticket size and the Y-axis for Daily, monthly, yearly, hierarchy.
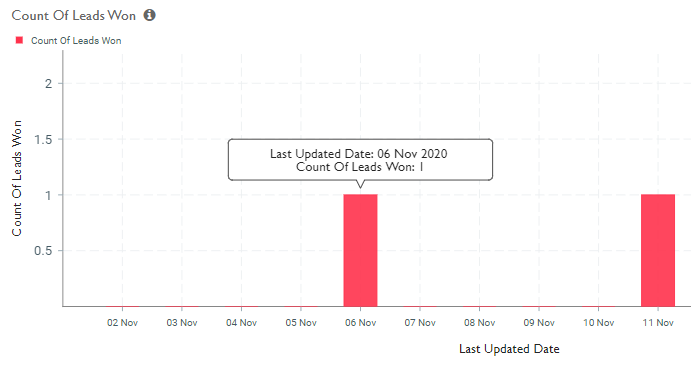
Pipeline Dashboard - Count of Leads Won
The graph shows the number of leads won every day. To see it, click Reports > All Reports > Lead Analytics > Pipeline Dashboard.
The X-axis is for Last update date and the Y-axis for Total leads won.
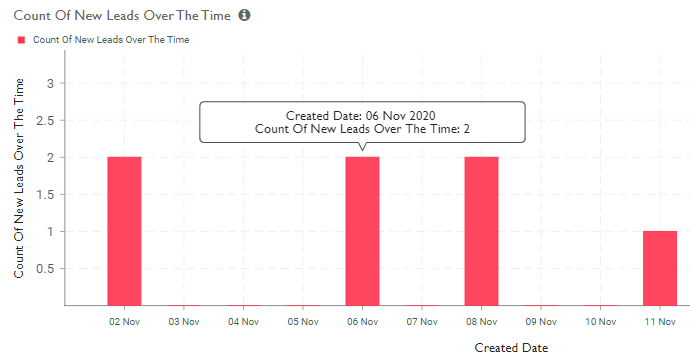
Pipeline Dashboard - Count of New Leads Over Time
This graph shows the number of leads created every day. To see it, click Reports > All Reports > Lead Analytics > Pipeline Dashboard.
The X-axis is for Created date and the Y-axis for Total leads.
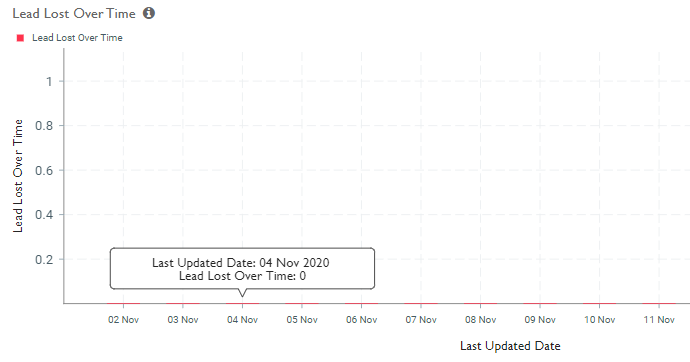
Pipeline Dashboard - Leads Lost Over Time
The graph shows the number of leads lost on a given date. To see it, click Reports > All Reports > Lead Analytics > Pipeline Dashboard.
The X-axis is for Last update date and the Y-axis for Total leads lost.
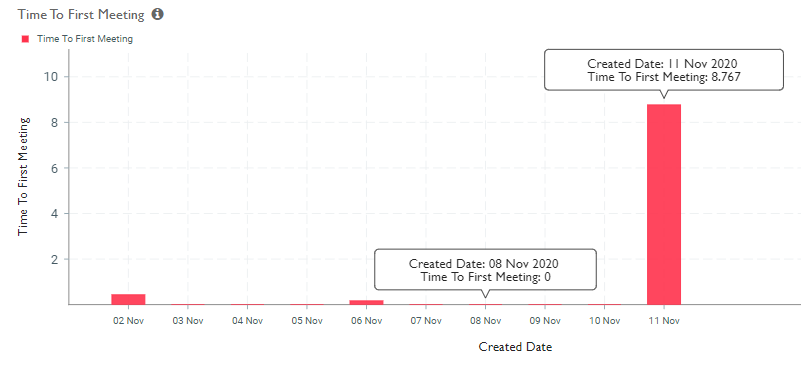
Pipeline Dashboard - Time to First Meeting
The graph shows the average time it took to set up the first meeting with a lead that was created on a given date. To see it, click Reports > All Reports > Lead Analytics > Pipeline Dashboard.
The X-axis is for Created date and the Y-axis for Time to first meeting, in minutes.
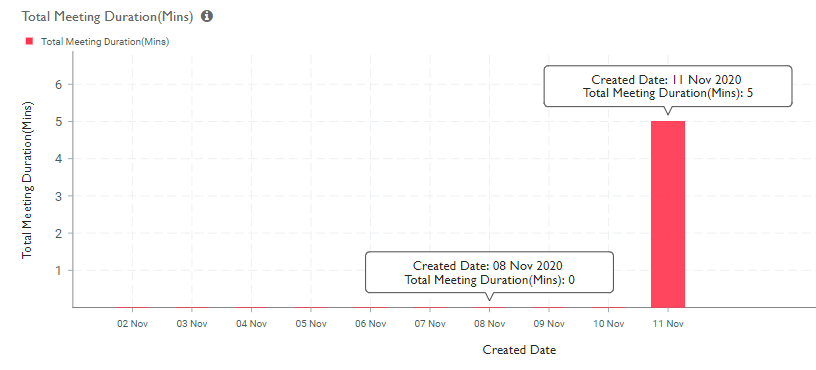
Pipeline Dashboard - Total Meeting Duration
This graph shows the the total amount of time spent on a meeting with the lead. To see it, click Reports > All Reports > Lead Analytics > Pipeline Dashboard.
The X-axis is for Created date and the Y-axis for Total meeting duration, in minutes.
Planned And Completed Lead Meetings - Completed Lead Meetings
This reports shows the number of meetings, whether repeat or for the first time, completed on any day. To see it, click Reports > All Reports > Lead Analytics > Planned And Completed Lead Meetings.
The report contains the following columns:
- User name: The person who met leads
- Fresh meetings completed: The total number of new lead meetings that day
- Repeat meetings completed: The total number of repeat meetings that day
Planned And Completed Lead Meetings - Fresh Lead Meetings By Date
This reports shows the number of leads met with for the first time on any day. To see it, click Reports > All Reports > Lead Analytics > Planned And Completed Lead Meetings.
The report contains the following columns:
- Date: The date
- Fresh meetings: The total number of first meetings that day with leads
Planned And Completed Lead Meetings - Leads Created By Date
This reports shows the number of leads created on any day. To see it, click Reports > All Reports > Lead Analytics > Planned And Completed Lead Meetings.
The report contains the following columns:
- Date: The date
- Leads created: The total number of leads created that day
Planned And Completed Lead Meetings - Meetings Scheduled
This reports shows the number of meetings scheduled and not yet completed on any day. To see it, click Reports > All Reports > Lead Analytics > Planned And Completed Lead Meetings.
The report contains the following columns:
- User name: The person who is scheduled to meet leads
- Live meetings: The total number of open meetings that day for that person
Planned And Completed Lead Meetings - Repeat Lead Meetings By Date
This reports shows the number of leads met with again on any day after the first meeting. To see it, click Reports > All Reports > Lead Analytics > Planned And Completed Lead Meetings.
The report contains the following columns:
- Date: The date
- Repeat meetings: The total number of repeat meetings that day with leads
Win-Loss Analysis
This reports shows the number of leads sourced, won, and lost by someone in a given time period. To see it, click Reports > All Reports > Win-Loss Analysis.
The report contains the following columns:
- Average Sales Cycle: Average time taken to call the lead for the first time where lead is won
- Average Meetings (Won Leads): Average number of meetings done with the lead before it's won
- Win Percentage of Total Opportunities: Average number of meetings done with the lead before it's won
- Win Count Per Agent: Average number of leads won per agent
- Average Sales Cycle (Days to Lose): Average time taken to call the lead for the first time where lead is lost
- Lost % of Total Opportunities: Percentage of leads created which are lost
- Lost Count Per Agent: Average number of leads lost by an agent
- Average Number of Meetings (Lost Leads): Average number of meetings it took before the lead was lost