Partners reports
The standard reports and dashboards available out of the box for partners are listed on this page. All of these reports, unless otherwise stated, can be downloaded as .csv files. Also, all of the reports can be filtered by user name and date range. Additional filters, if available, are mentioned in the report description.
The metrics used for calculating the numbers in these reports is at Partners metrics.
- Completed Tasks Over Time
- Engaged By User
- Engagement by day
- Median Meeting Duration (By Day)
- Meeting by day
- Outcome
- Overall Planned Task Breakdown
- Partner engagement report
- Partners Cover
- Partners list
- Planned Tasks Over Time
- Task Planning
- Task Prioritization
- Tasks/Rep/Day
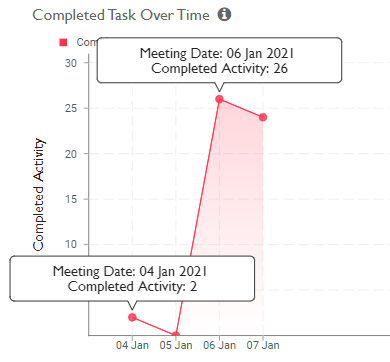
Completed Tasks Over Time
This chart shows the number of tasks completed, by the date when the activity was last updated. To see it, click Reports > All Reports > Partner Analytics > Task Planning.
The X-axis is for the dates and the Y-axis for the numbers.
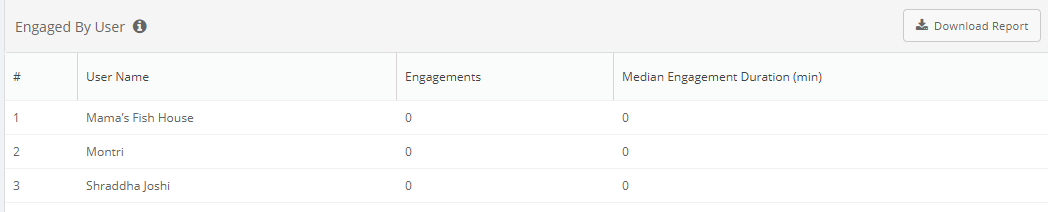
Engaged By User
This report shows a user level detail on the number of engagements by the user and and median of time taken for each engagement. To see it, click Reports > All Reports > Partner Analytics > Engagement Coverage Intensity.
The report contains the following columns:
- User: Name of the person
- Engagement: Number of completed activities
- Median Engagement Duration: Median of time taken for each of the engagements
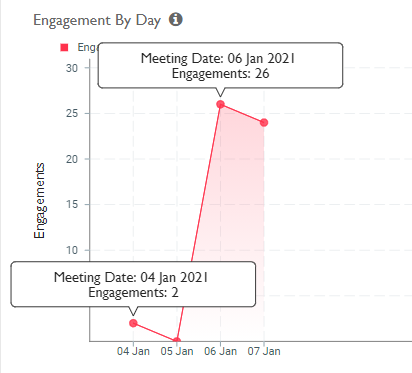
Engagement by day
This graph shows the number of activities completed daily by the team. To see it, click Reports > All Reports > Partner Analytics > Engagement Coverage Intensity.
The X-axis is for the dates when the activity was completed and the Y-axis for the total number of engagements by the team.
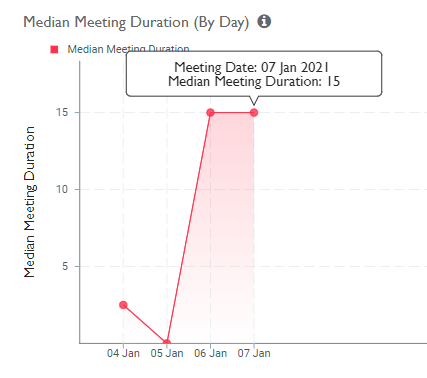
Median Meeting Duration (By Day)
This graph shows the time spent by team on each meeting. To see it, click Reports > All Reports > Partner Analytics > Engagement Coverage Intensity.
The X-axis is for the dates when the activity was completed and the Y-axis for the median of the time taken for each of the meetings.
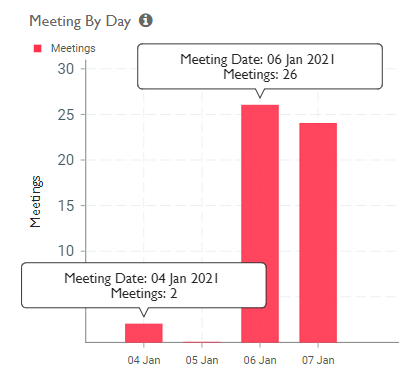
Meeting by day
This graph shows the number of activities completed daily by the team. To see it, click Reports > All Reports > Partner Analytics > Engagement Coverage Intensity.
The X-axis is for the number of completed meetings and the Y-axis for the date when the meeting was completed.
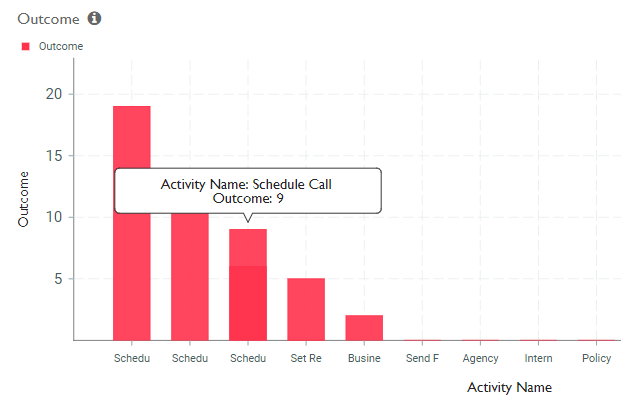
Outcome
This graph shows the total number of completed activities, by type, in a date range. To see it, click Reports > All Reports > Partner Analytics > Task Distribution.
The X-axis is for the various activities and the Y-axis for the numbers.
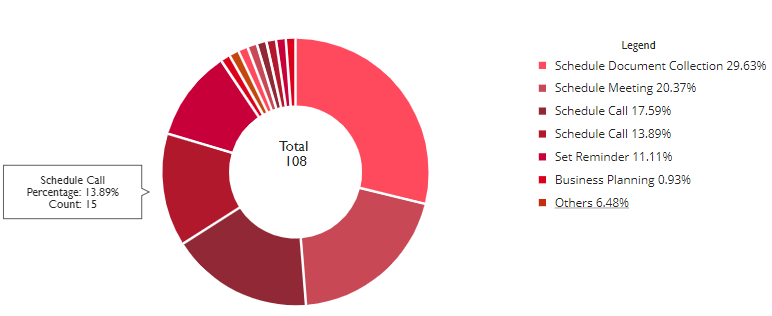
Overall Planned Task Breakdown
This pie chart shows the proportional share of the various planned activities in a date range. To see it, click Reports > All Reports > Partner Analytics > Task Distribution.
The various planned activities form the portions of the pie.
Partner engagement report
To see it, click All reports > Activities Analytics > Partner engagement report.The report contains the following columns:
- Partners name: Name of the active partners of the selected module
- Assignee: The person or user to who the partner is assigned
- Last engaged on: Date and time of the last activity with the partner
- Activities in selected date range: Number of times the partner was engaged in the selected date range
- No. of X activities: No. of activities of X activity type performed in the selected date range. X could be any activity as per your company.
- No. of Physical visits: This column is shown if geo-verified visit or automatic detection feature is enabled
- Avg. time per visit: Average time for each visit. This column is shown if the automatic visit detection feature is enabled
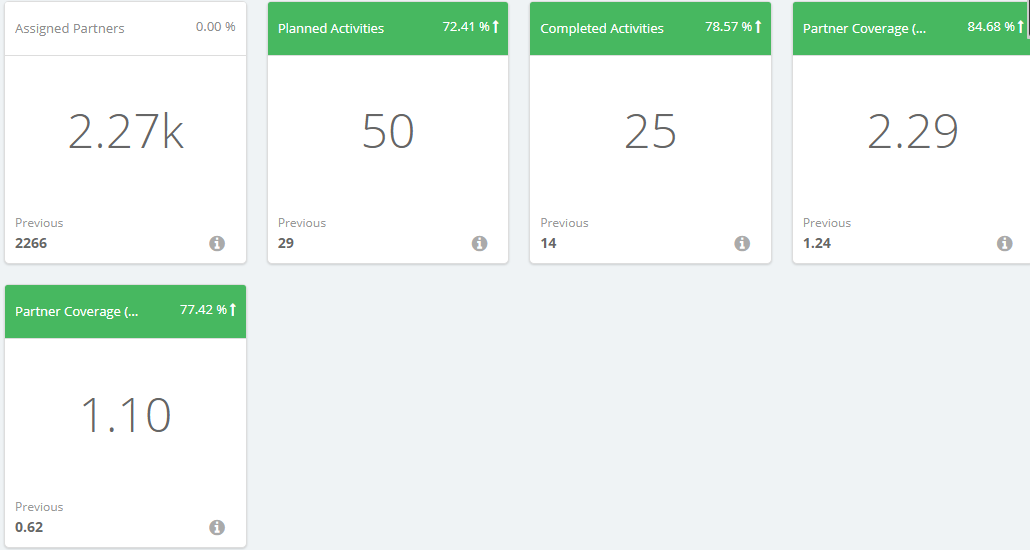
Partners Cover
This dashboard shows the numbers for planned and completed partner activities. To see it, click Partners > Partners list.
The report contains the following columns:
- Assigned Partners: None
- Planned Activities: None
- Completed Activities: None
- Partner Coverage (Planned): None
- Partner Coverage (Completed): None
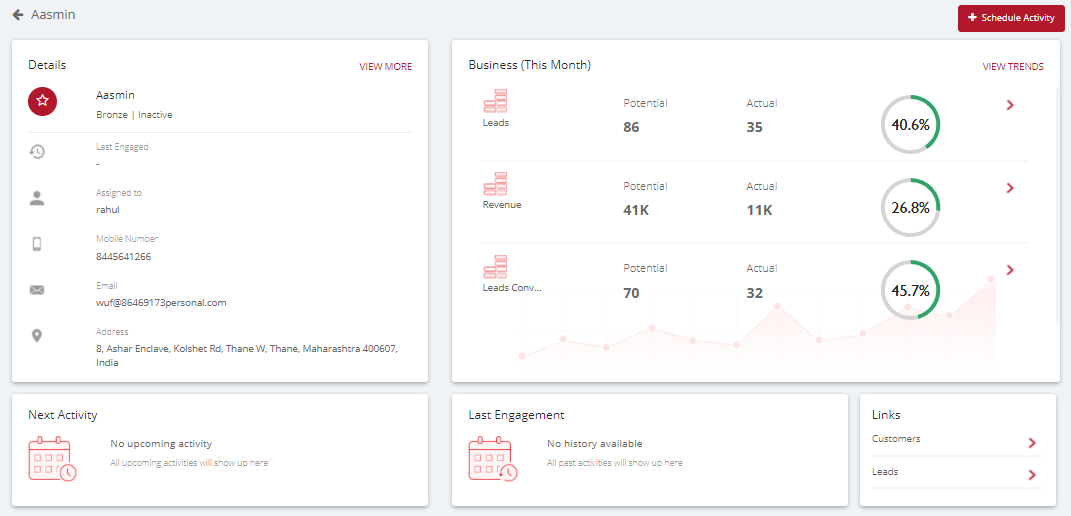
Partners list
This report summarizes the details of partners. Clicking on a partner reveals further details, as shown in the image. To see it, click Partners > Partners list.
The report contains the following columns:
- Created: None
- Meeting: None
- Lead Name: None
- Current State: None
- Assigned To: None
- Last Update Date: None
- Potential Revenue: None
- Actual Revenue: None
- Engagement Frequency: None
- Status: None
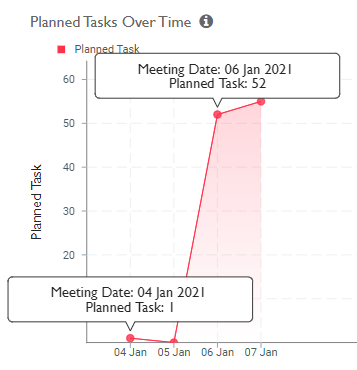
Planned Tasks Over Time
This chart shows the number of tasks planned, by the date when the activity was last updated. To see it, click Reports > All Reports > Partner Analytics > Task Planning.
The X-axis is for the dates and the Y-axis for the numbers.
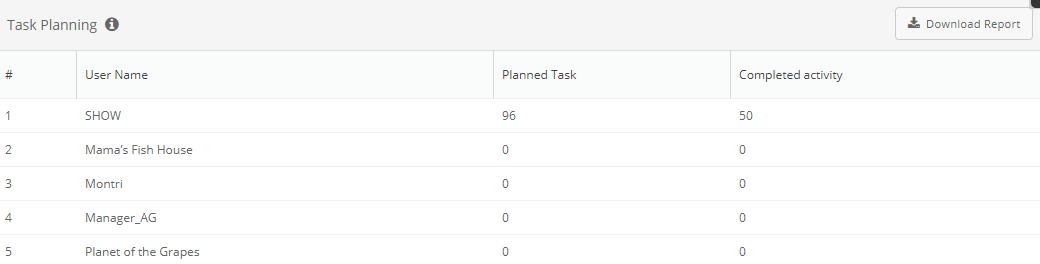
Task Planning
This table shows the number of planned and completed tasks by the entire team. To see it, click Reports > All Reports > Partner Analytics > Task Planning.
The report contains the following columns:
- User name: The name of the person to whom these tasks were assigned
- Planned task: The number of planned tasks
- Completed activity: The number of completed tasks
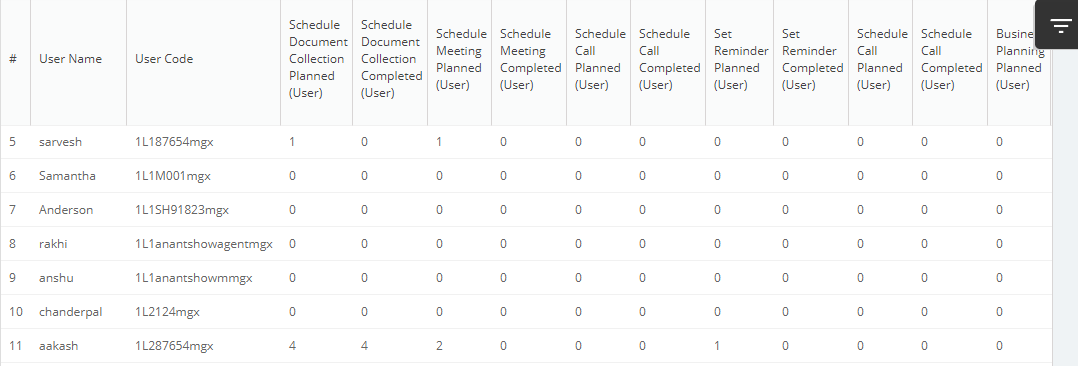
Task Prioritization
This report shows the type of activities planned and completed by the team. To see it, click Reports > All Reports > Partner Analytics > Other Task Report.
The report contains the following columns:
- User Name: The name of the person
- User Code: The employee code of the person
- Activities columns: A column for each configured activity that's been completed by the person
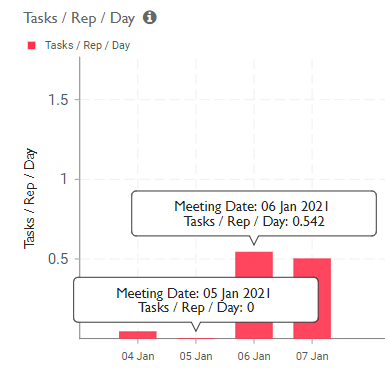
Tasks/Rep/Day
This graph shows the average of the number of activities complete by a person in a day against the date the activities were completed. To see it, click Reports > All Reports > Partner Analytics > Task Efficiency.
The X-axis is for the dates and the Y-axis for the numbers.