User activities reports
The standard reports and dashboards that are available out of the box for user activities are listed on this page. All of these reports, unless otherwise stated, can be downloaded as .csv files. Also, all of the reports can be filtered by date range and person. Additional filters, if available, are mentioned in the report description.
- Active Users
- Activities By User (last 30 days)
- Adoption & Usage Summary
- Adoption (last 30 days)
- Geo
- List Of Users To Be Billed
- Partner engagement report
- Travel summary
- User Billing Report
- User Call Report
- User Device Events
- Users Device (last 30 days)
- Work calendars connected
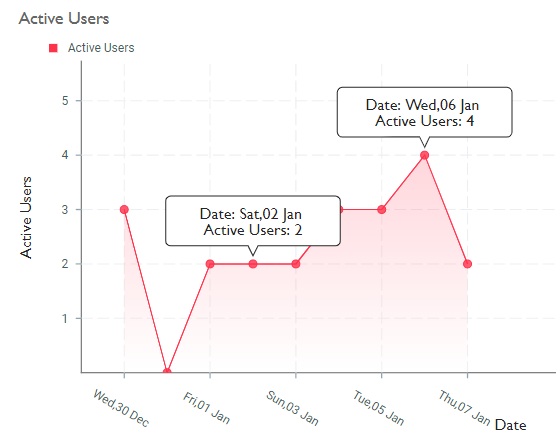
Active Users
This chart shows the number of people who actively used the app on a given day.
Data of only the last 6 months is available.
To see it, click Geo & Adoption > Adoption & Usage.
This report has additional filters of login status.
The X-axis is for the date and the Y-axis for number of people who actively used the app that day.
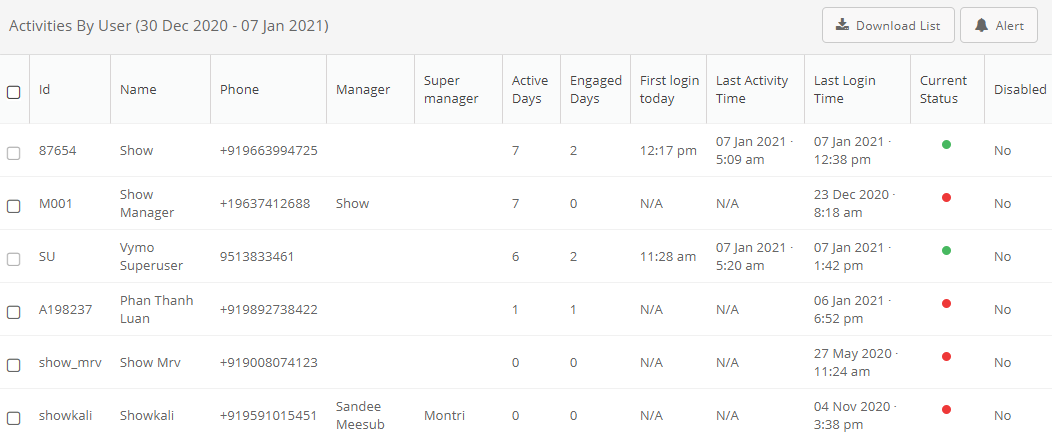
Activities By User (last 30 days)
This report shows the person-wise usage and login information.
Data of only the last 6 months is available.
To see it, click Geo & Adoption > Adoption & Usage.
This report has additional filters of login status.
The report contains the following columns:
- ID: The person's employee ID
- Name: The person's name
- Phone: The person's phone number
- Manager: The name of the reporting manager
- Super manager: The name of the reporting manager's manager
- Active days: The number of days the person actively used the app
- Engaged days: The number of days the person was logged in to the app
- First login today: The time that the person first opened the app or logged in
- Last activity time: The time of the last recorded activity on the app
- Last login time: Captures the timestamp of the user's most recent logged in session
- Current status: The current status of the person (Logged in, not logged in, or facing location issues)
- Disabled: Whether the person remains an active employee
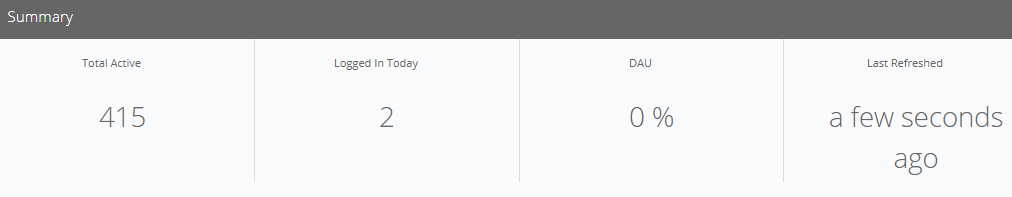
Adoption & Usage Summary
This card shows the number of people who're using the app, and the number who've logged in that day and are actively using it.
Data of only the last 6 months is available.
To see it, click Geo & Adoption > Adoption & Usage.
This report has additional filters of login status.
The report contains the following columns:
- Total active: The total number of people who're using the app
- Logged in today: The number of people who're logged in to the app that day
- DAU: The number of users who're actively using the app that day
- Last refreshed: Timestamp of the data capture
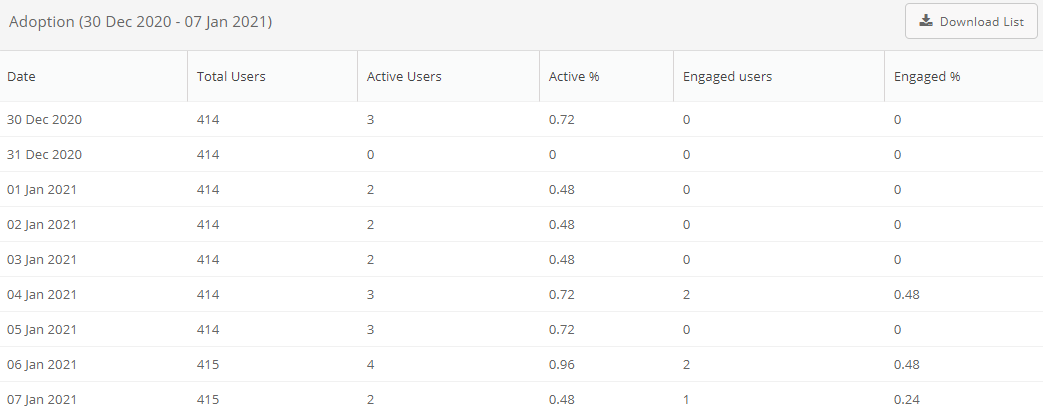
Adoption (last 30 days)
This report shows the daily numbers and percentage of people who've been actively using the app.
Data of only the last 6 months is available.
To see it, click Geo & Adoption > Adoption & Usage.
This report has additional filters of login status.
The report contains the following columns:
- Date: The date
- Total Users: The number of people who were logged in to the app that day
- Active Users: The number of people who actively used the app that day
- Active %: The ratio of active users to total users
- Engaged Users: The number of people who're logged in at that time
- Engaged %: The ratio of engaged users to total users
Geo
This report shows the person-wise location information on a map as well as a table. To see it, click Geo & Adoption > Geo > Table view. This report has additional filters of duration (that day, last 15 minutes, last 30 minutes, last hour, last 2 hours).
The report contains the following columns:
- User: The name of the person
- Time: The time the location was captured
- Address: The address where the person is present at that time
- Battery%: The remaining battery percentage
- Accuracy (mts): The margin of error, in meters, in detecting the address
- Latitude: The latitude of the address
- Longitude: The longitude of the address
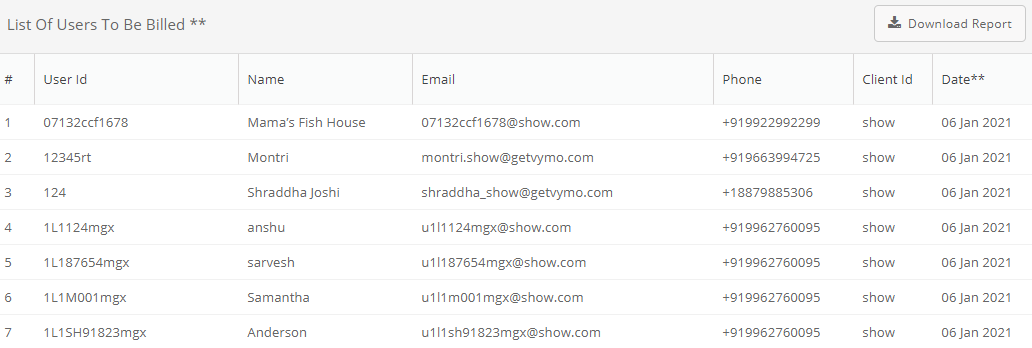
List Of Users To Be Billed
This report shows the users to be billed in a specific time period.
You can allow or restrict over-usage. If allowed, you can enable or create users beyond the licensed limit.
If your company has users from multiple business divisions, you can also specify division-level user limits. If this limit is specified, you cannot enable or create users beyond this limit, even if over-usage is allowed for the company.
To see it, click Reports > All Reports > User Reports > Billing Report - User List.
This report has additional filters of date range and team.
The report contains the following columns:
- User ID: The employee ID of the person
- Name: The name of the person
- Email: The email ID of the person
- Phone: The phone number of the person
- Client ID: The ID of the organization that the person belongs to
- Date: The date when maximum users were enabled
Partner engagement report
To see it, click All reports > Activities Analytics > Partner engagement report.The report contains the following columns:
- Partners name: Name of the active partners of the selected module
- Assignee: The person or user to who the partner is assigned
- Last engaged on: Date and time of the last activity with the partner
- Activities in selected date range: Number of times the partner was engaged in the selected date range
- No. of X activities: No. of activities of X activity type performed in the selected date range. X could be any activity as per your company.
- No. of Physical visits: This column is shown if geo-verified visit or automatic detection feature is enabled
- Avg. time per visit: Average time for each visit. This column is shown if the automatic visit detection feature is enabled
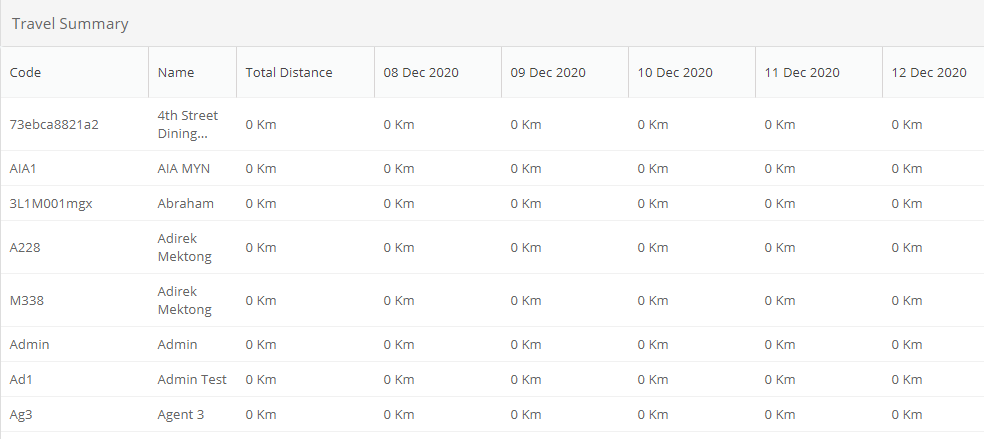
Travel summary
This report shows the daily distances covered by a person. To see it, click Geo & Adoption > Travel summary.
The report contains the following columns:
- Code: The employee ID of the person
- Name: The name of the person
- Total distance: The distance covered by the person in the last 30 days
- Dates: The distance covered by the person that day (a column for each day, the last 30 days)
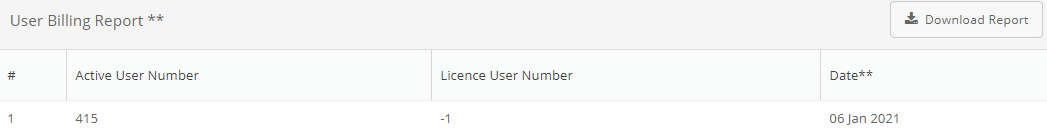
User Billing Report
This report shows the number of users to be billed for a specific time period. To see it, click Reports > All Reports > User Reports > Number of Users Billed.
The report contains the following columns:
- Active users: Total number of users for which the client will be billed
- Licensed users: Total number of contracted users
- Date: Date when the maximum users were enabled
User Call Report
This report shows daily trends on calls. You can see the average number of calls made, average call duration, call completion rate (calls connected divided by the total calls made), and the status (whether completed, busy, not answered, or failed).
Call recordings are also available. If you don't see them, contact Vymo Support.
To see it, click Reports > Call Reports > User Call Reports.
This report has additional filters of date range, team, and hour.
The report contains the following columns:
- User Code: The employee code
- User Name: The name of the person
- Lead or Partner Name: The name of the lead or partner who was called
- Call Start Time: The time when the call was placed through the app
- Call End Time: The time when the call was ended
- Duration: The duration of the call, which includes the time taken by the device to connect to a web telephone service, and the time elapsed before the other person answered the call
- Call status: Whether the call went through, was answered, or was cancelled
- Recording URL: A click-and-listen link to the call recording
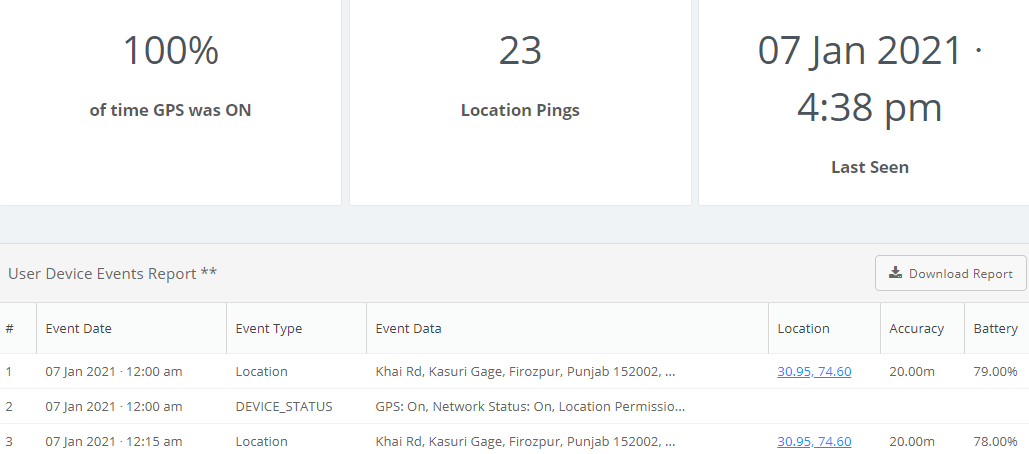
User Device Events
This report shows the events generated by the mobile device. To see it, click Reports > All Reports > User Reports > User Device Events Report.
The report contains the following columns:
- User: User whose report is being generated
- Location Pings: Number of times the location was captured in a specific time period
- Last Seen: User's last known location at a specific time
- Event Date: Timestamp of the event capture
- Event Type: Type of event (Location/GPS/Network)
- Event Data: Data captured for the event
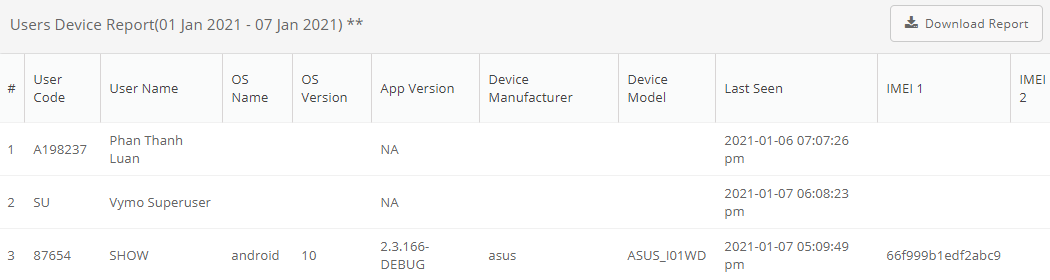
Users Device (last 30 days)
This report gives the details of the mobile devices your team uses. Use this report to track devices that are on the Allowed list, and to detect any suspicious logins. To see it, click Reports > All Reports > User Reports > User Mobile Device Events Report.
The report contains the following columns:
- User Code: Employee ID of the person.
- User Name: Name of the person.
- OS Name: The operating system the device runs on (whether it's Android or iOS).
- OS Version: The version number of the operating system.
- App Version: The Vymo app version number that's installed on the device at the time of login.
- Device Manufacturer: The device manufacturer's name.
- Device Model: The device model name.
- Last Seen: The last time that the user did any activity on the Vymo app through the device.
- IMEI1: For Android 9 or earlier, the IMEI1 number.
For Android 10 or later, and iOS, not available . - IMEI2: If the device has another SIM card, the IMEI2 number.
- Device ID: For Android 10 or later, the Android ID.
For iOS, the UDID.
Device IDs are not proven to be unique; in case of manufacturing faults, multiple devices can have the same device ID.
If a factory reset is done, the device ID changes and the person must enable the required permissions again.
If the OS version of an Android device is updated, the device ID changes. The person must uninstall the Vymo app, install it again, and enable the required permissions.
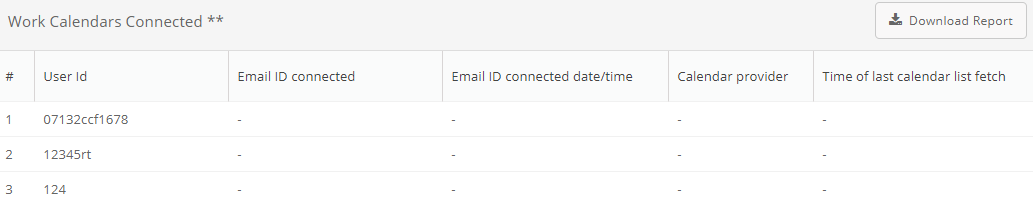
Work calendars connected
This report shows the work calendars that are connected to the app. To see it, click Reports > All Reports > User Reports.
The report contains the following columns:
- User ID: The employee ID of the person
- Email ID connected: The email ID of the person
- Email ID connected date and time: The time when the calendar was connected to the Vymo app
- Calendar provider: The name of the calendar, for example Outlook calendar or Google calendar
- Time of last calendar list fetch: The last time when the calendar events were fetched