Sales Performance Dashboard Manager
Introduction
As a manager, your role is pivotal in steering your team towards achieving its goals. With Vymo Sales Performance Management (SPM), you are equipped with an intuitive solution designed to empower you and your sales teams. Through Vymo SPM, you gain unprecedented visibility, control, and coaching capabilities. By leveraging the comprehensive suite of performance widgets, you can gain real-time insights into team and individual achievements, ensuring you're always a step ahead in strategizing and making informed decisions.
Furthermore, the system seamlessly integrates with a unique hierarchy structure, ensuring consistency despite frequent organizational changes. With detailed UI components like the "Performance Leaderboard", you can zoom into specifics, track rankings, and understand metrics that drive success. Vymo SPM is your comprehensive tool for a 360-degree view of your team's performance.
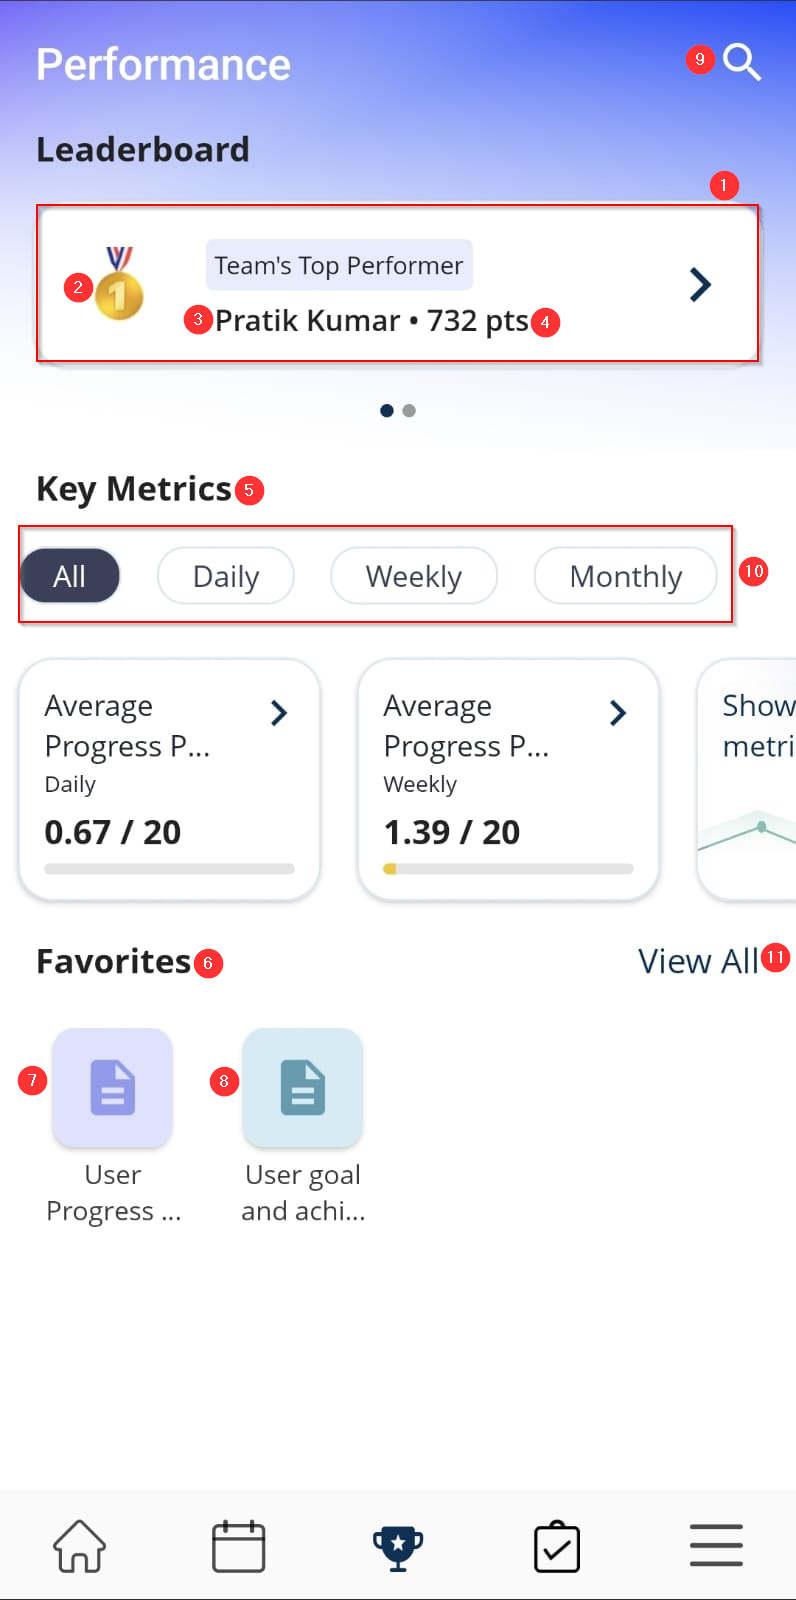
1 - Team Rankings: This is the main component, which displays a list of the top performers in order of points earned by them. Each row in the leaderboard includes the following information:
-
2 - Rank: The team’s top performer's current rank on the leaderboard.
-
3 - Name: The team’s top performer's name.
-
4 - Points: The team’s top performer's total number of points.
5 - Key Metrics: This section displays the key metrics used to rank performers on the leaderboard.
6 - Favorites: Users can pin their favorite reports in this section.
In addition to these main components, the Performance Leaderboard dashboard also includes several other UI elements, such as:
9 - SearchBar: The search bar allows users to search for specifics.
10 - Filter Bar in Key Metrics: The filter bar allows users to filter the leaderboard by different criteria, such as daily, weekly, and monthly.
11 - View All: The View All button allows users to access additional features that are marked as favorites, such as the User Progress Dashboard and User Goal and Achievement Report.
Leaderboard:
My Team's Standings:
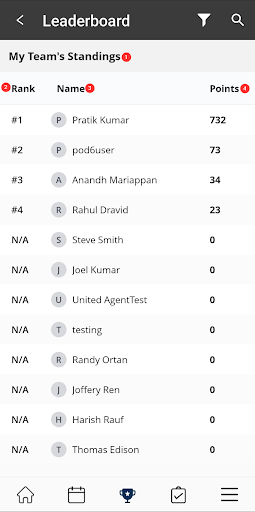
1 - My Team's Standings: A section that shows the user's team's current ranking and points earned.
2 - Rank: The team's current rank on the leaderboard.
3 - Name: The team member's name.
4 - Points: The total number of points earned by each individual in the team.
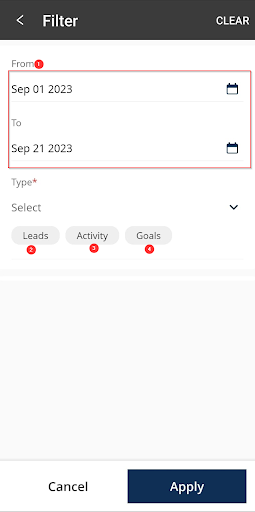
Filter Button:
Search options within my team’s standings.

1 - Time Period: This filter allows users to filter the leaderboard by specific From and To dates.
2 - Leads: This filter allows the user to filter the leaderboard by lead transitions or creation.
3 - Goals: This filter allows the user to filter the leaderboard by a specific goal set by the higher authorities. This can be useful for tracking the performance of a specific team or comparing the performance of different teams and their goals.
4 - Activity: This filter allows the user to filter the leaderboard by a specific activity. This can be useful for tracking performance on a specific activity or comparing performance on different activities.
Self Leaderboard
The self-leaderboard is the agent’s stack rank against his/her peers. The points earned are the number of points that the user has accumulated. The points earned are typically calculated based on the user's performance towards their goals.
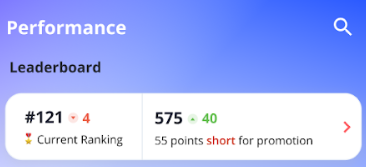
Current Ranking: The user's current rank on the leaderboard.
Points Earned: The user's total number of points earned by them.
My Standings
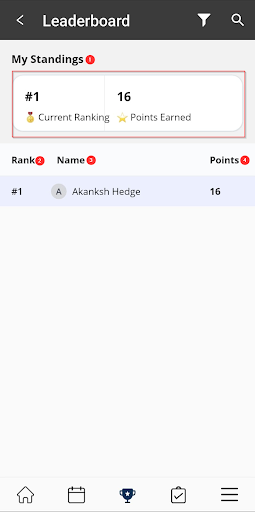
1 - My Standings: A section that shows the user's current ranking and points earned.
2 - Rank: The user's current rank on the leaderboard.
3 - Name: The user's name.
4 - Points: The total number of points earned by the individual.
Filter Button:
Search options within my team’s standings.
1 - Time Period: This filter allows users to filter the leaderboard by specific From and To dates.
2 - Leads: This filter allows the user to filter the leaderboard by specific lead transitions or creation.
3 - Goals: This filter allows the user to filter the leaderboard by a specific goal set by the higher authorities. This can be useful for tracking the performance of a specific team or comparing the performance of different teams and their goals.
4 - Activity: This filter allows the user to filter the leaderboard by a specific activity. This can be useful for tracking performance on a specific activity or comparing performance on different activities.
- Note: Peer ranking is determined by agents that report to the same manager.
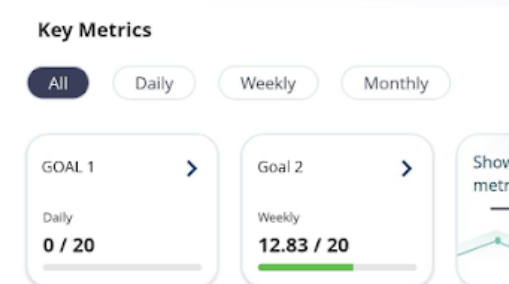
### Key Metrics
Why Use Key Metrics? Customizable Metrics for Your Needs: Whether it's leads created, activities completed, or external data like policy premiums collected, Vymo SPM allows you to define and track the metrics that matter most to you and your organization.
Frequency Flexibility: You can configure your metrics to be updated daily, weekly, monthly, quarterly, or yearly. This means you can track short-term objectives and long-term ambitions with equal ease. Target Setting: Beyond just measuring, you can set specific targets for each metric. Once set, your achievements will be juxtaposed against these targets, enabling a clear view of your progress.
Visual Indicators: Set thresholds to give color-coded visual feedback. At a glance, determine if you're on track or if a particular goal is at risk.
Managerial Insight: If you're a manager, the drill-down feature lets you delve into the detailed performance metrics of your team members. It empowers you with the data you need to guide, support, and make informed decisions.
The key metrics come equipped with filters for daily, weekly, monthly, quarterly, and yearly views. It's a straightforward way to zero in on the data that's most pertinent to your current objectives.
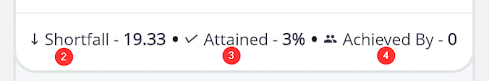
2 - Shortfall: This section shows the difference between the user's goal and the number of points they have attained. For example, if a user has a goal of earning 100 points per day and they have earned 50 points, their shortfall would be 50 points.
3 - Attained: This metric shows the percentage of the target that the user has achieved. For example, if the target is 500 and the user has achieved 250, then 50% of the target has been attained.
4 - Achieved by: This section shows As a manager it shows how many reporters under him achieved the target for that particular goal.
Historic Trend
The historic trend section of a user progress dashboard typically depicts the user's progress over time. The historic trend section can be used to: - Track progress over time: By tracking their progress over time, users can see how they are progressing towards their goals. This information can be used to identify trends and to make adjustments to their goals as needed. - Identify areas where improvement is needed: By comparing their current progress to their previous progress, users can identify areas where they need to improve. For example, if a user's progress has slowed down, it may be time to increase their efforts or adjust their goals.
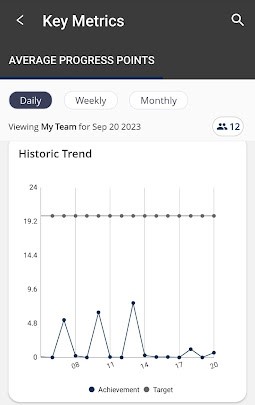
Performance Progression Analysis
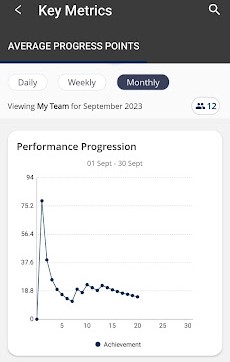
If you swipe right on the historic trend you will be taken to the performance progression section that can be used to identify trends in the user's progress. The graph shows the user's progress toward a goal over time.
Team Breakdown
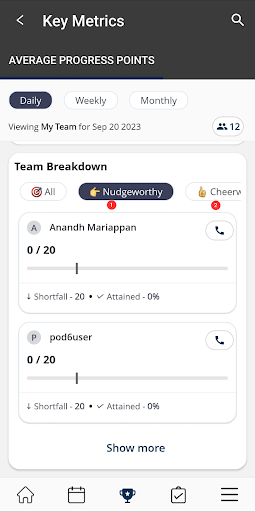
The nudgeworthy and cheerworthy sections of a user progress dashboard are two sections that are designed to encourage users to improve their performance.
1 - Nudgeworthy The nudgeworthy section is designed to help users identify areas where they may need to improve their performance to achieve their goals. This can be done by comparing the user's performance to a threshold that has been set for a particular metric.
2 - Cheerworthy The cheerworthy section is designed to help users identify and celebrate their achievements to motivate them to continue to improve their performance. This can be done by comparing the user's performance to a threshold that has been set for a particular metric.
- Note: By default, users are nudged if their estimated achievement is below 20% of the target, and cheered on if it is above 80%.
Favorites
The Favorites section of Vymo SPM, is your personalized hub for swift and efficient access to crucial data points. Tailor your dashboard by pinning relevant widgets, metrics, or reports, ensuring that your most-used tools are always just a click away. As the sales landscape evolves, so can your Favorites, allowing for a dynamic and adaptable experience. Whether you're streamlining your own workflow or collaborating with team members, the Favorites feature is designed to elevate your Vymo SPM experience. Embrace organization, accessibility, and control, all in one place.