Campaigns reports
The reports for parent campaigns aggregate the data from child campaigns. To see a report, select the campaign from the filter list.
Campaign details
Information about the campaign dates and status is displayed at the top. The report has the following sections.
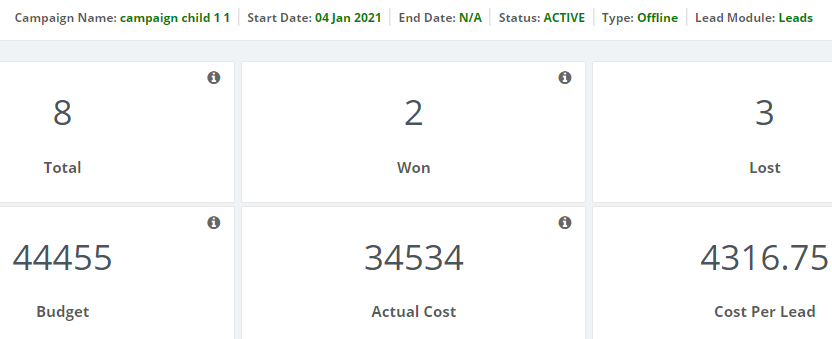
Campaigns Dashboard
This dashboard has cards that give a snapshot of the campaign that you select from the filter list. To see it, click Reports > All Reports > Campaign Details. The cards show you the following information:
- Total: Number of leads generated during the campaign
- Won: Number of leads won during the campaign
- Lost: Number of leads dropped during the campaign
- Budget: The financial outlay of the campaign
- Actual Cost: The money spent on the campaign
- Cost per lead: The ratio of the total leads generated during the campaign to the actual cost of the campaign
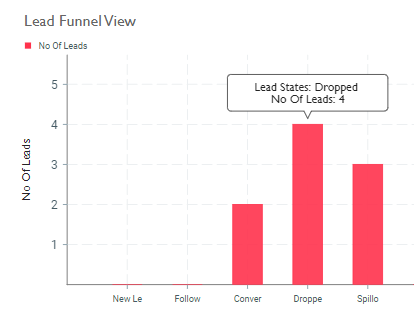
Lead Funnel View
This graph shows the number of leads, by lead state. To see it, click Reports > All Reports > Campaign Details. The X-axis is for Lead States and the Y-axis for Number of leads.
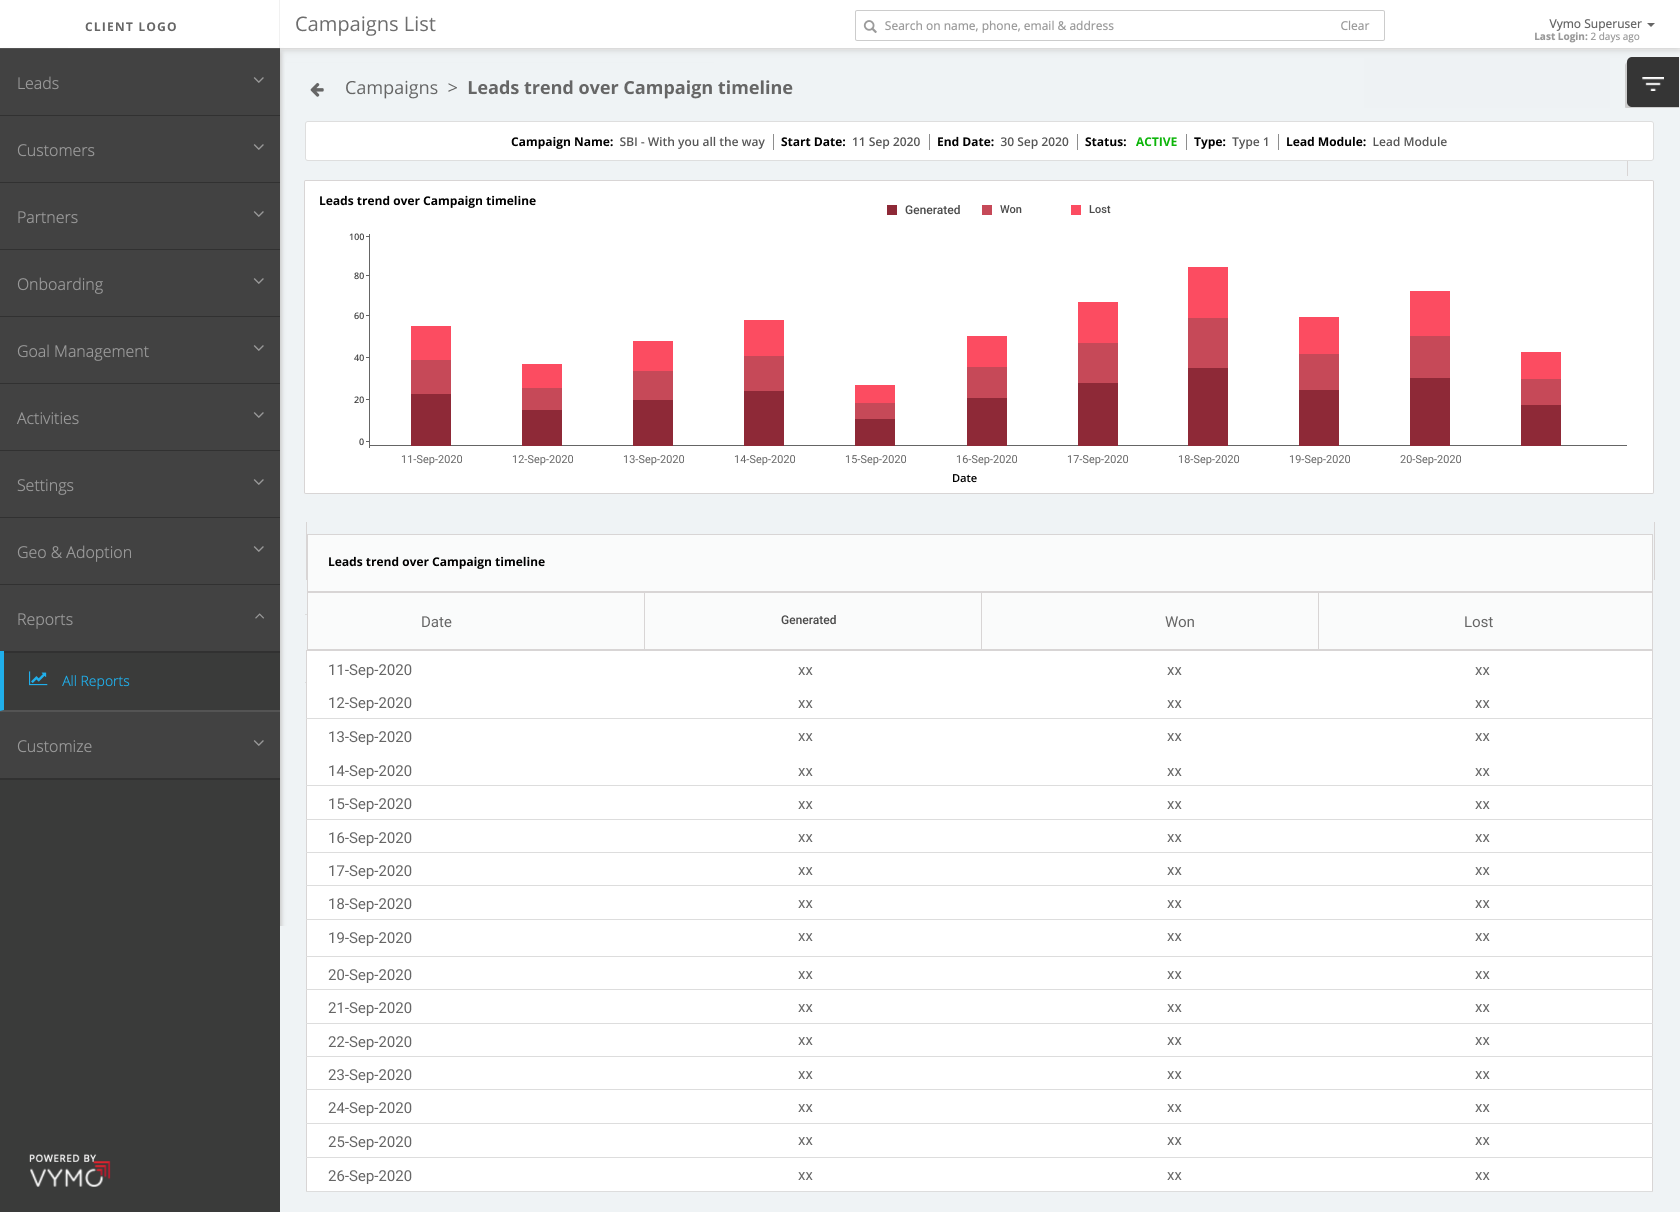
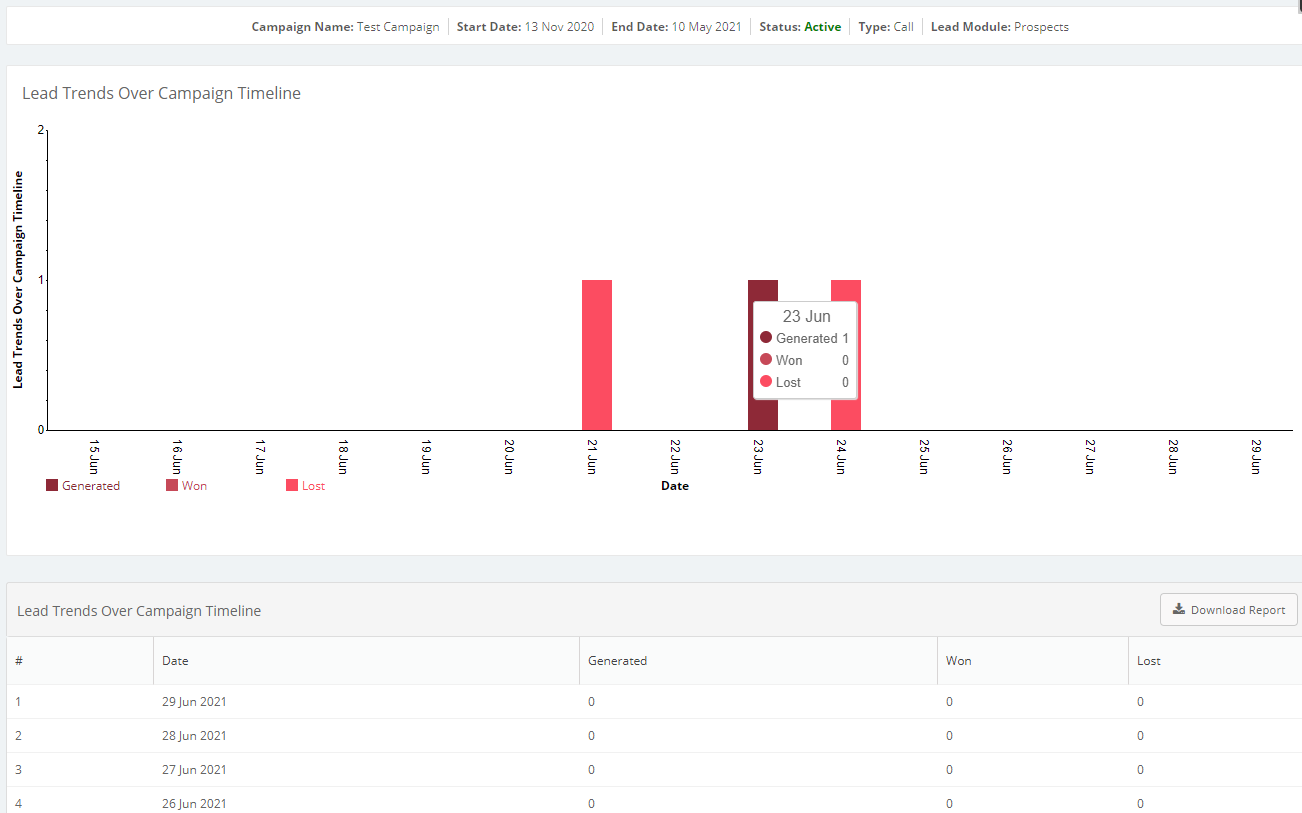
Lead Trends Over Campaign Timeline
This graph and report shows the numbers for leads added, won, and dropped daily during the campaign period. Data is shown for 15 days from campaign end or from today, whichever is earlier, and there's a link to a report that has the data for entire campaign period. To see it, click Reports > All Reports > Campaign Details. The X-axis is for the date and the Y-axis for Number of leads.
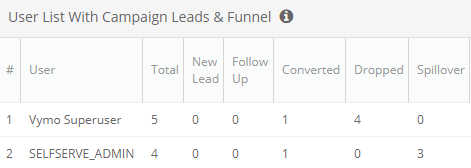
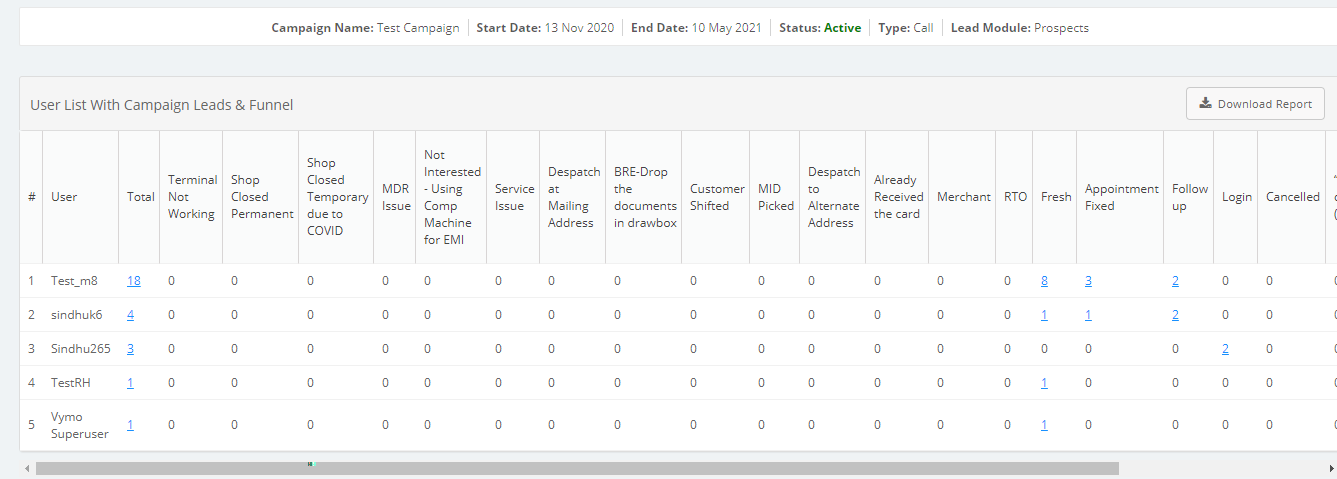
User List With Campaign Leads & Funnel
This table shows the data for 20 people who've generated the most number of leads. It also has a link to a report that shows the data for everyone. To see it, click Reports > All Reports > Campaign Details. The table has the following information:
- User: The name of the person
- Total: The number of leads generated by the person during the campaign
- State: The number of leads in each state of the leads workflow, with a column for each state
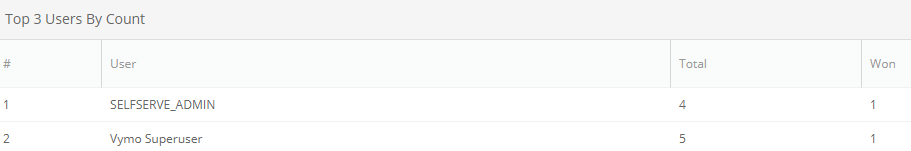
Top 3 Users By Count
This table shows the data for 3 people with the most wins during the campaign period. To see it, click Reports > All Reports > Campaign Details. The table has the following information:
- User: The name of the person
- Total: The number of leads generated by the person during the campaign
- Won: The number of leads won during the campaign
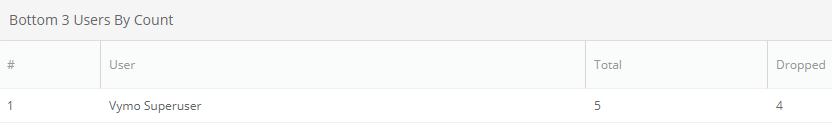
Bottom 3 Users By Count
This table shows the data for 3 people with the most dropped leads during the campaign period. To see it, click Reports > All Reports > Campaign Details. The table has the following information:
- User: The name of the person
- Total: The number of leads generated by the person during the campaign
- Dropped: The number of leads dropped during the campaign
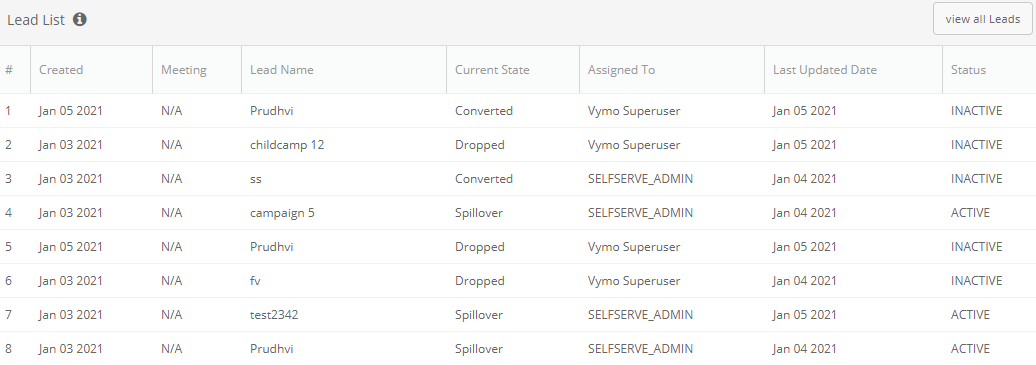
Leads List
This table shows data for the most recently updated 30 leads. It also has a link to a report that shows the data for all leads generated during the campaign. To see it, click Reports > All Reports > Campaign Details. The table has the following information:
- Created: The date when the lead was created
- Lead name: The name of the lead
- Current state: The state that the lead is currently in
- Assigned to: The person that the lead's been assigned to
- Last update date: The date when the lead details were last updated
- Status: Whether the lead is active or inactive
Lead Trends Over Campaign Timeline
This report that has the data for entire campaign period. The numbers are for leads added, won, and dropped daily during the campaign period. To see it, click Reports > All Reports > Lead Trends Over Campaign Timeline.
Userwise campaign Lead Summary
This report has the numbers for all leads generated by every person on your team. To see it, click Reports > All Reports > Userwise campaign Lead Summary.
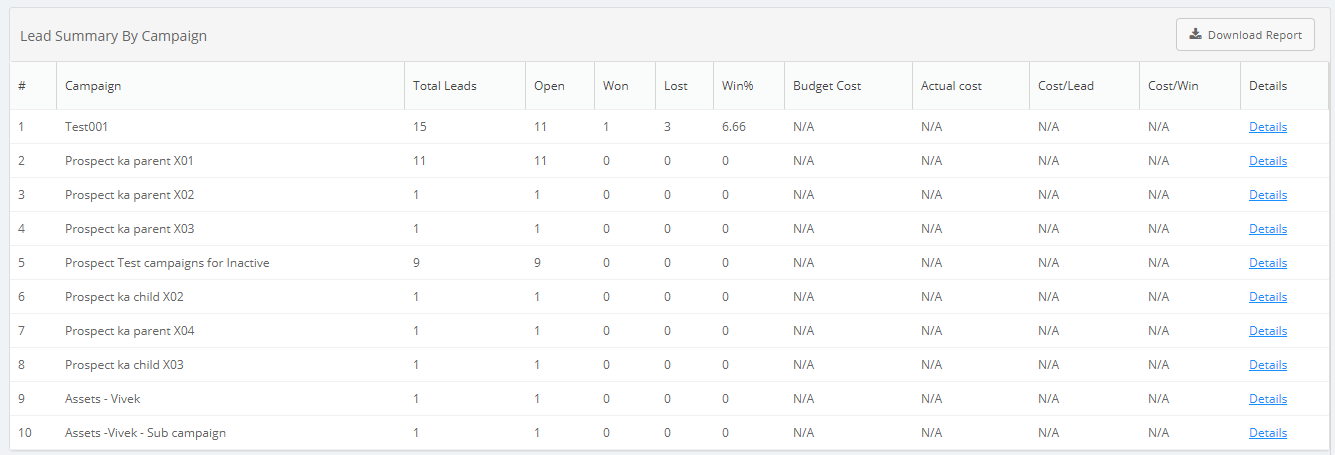
Lead Summary by campaign
This report has the numbers for all your campaigns. To see it, click Reports > All Reports > Lead Summary by campaign.